Before the analysis of today's market, I would like to give you some explanations to my report just in case any readers get confused.
- Do not expect I will give a clear and firm signal to go short or long the market. Different market signals always have conflicts with each others, and you have to do your own due diligence all the time. What I intend to do is to list those key signals to you, which can save you plenty of time on reading over a hundred of charts. From these conflicting signals, you however should judge whether the market will likely rise or drop.
When the market is in range bounding, new traders may find it difficult to make a judgement. In my report I will tell you how the market will likely go in term of probability. You have to decide when it is the best time to move -- the probability at 50% or 90%. Just don't expect a probability of 100%. - My official list of signals is 0.0.0 Signal Watch and Daily Highlights. I will update the chart from time to time, and you may choose several signals on the chart as your trading guidance. However, these signals by no means represent my market outlook. I just report those signals, again, not make a decision on your behalf. One thing for sure is that, my trading follows the signals in 0.0.0 as it should.
- At the end of my daily market recap, there are usually some charts where RSI2 are extremely oversold or overbought. But this part is not an emphasis partially because an oversold market can become even more oversold, so can an overbought market. For instance, I have been saying the energy sector is due for a rebound for several days, while the extreme situation is that the market does not go as expected day after day. My intention is to remind you but not to give your a trading advice. I may or may not trade on them. For new traders, I kindly advice you do not trade against the trend shown by the mid-term signals on 0.0.0 chart, even if the market is extremely oversold or overbought. Take the energy sector for instance again, because most mid-term signals on 0.0.0 chart are bearish red, new traders should refrain from touching this sector although it is extremely extremely oversold at the time being.
- At last, if you find my daily market recap informational, please access my chart book. I attach those charts in my chart book in this report is for your convenience. However you may still learn some new things or discover more information by accessing the chart book. Therefore I strongly recommend you to do so.
Today we got no follow-through since all the gain yesterday was overridden by today's selling-off, so the mid-term outlook is still Bearish. Of course in case the market claims all the loss back tomorrow, I will have a new analysis. Nevertheless, the second day follow-through is very important and a single-day up/down does not mean anything because the market seems irrational in these days. On the other hand, the following analysis will tell you that the probability of following through today's selling off is high.
I tend to believe that the market showed a true direction today. Compare with three evidences presented in the last report:
- 1.0.7 S&P 500 Large Cap Index (Major Accum/Dist Days). Today is the second Major Distribution Day, and the emotion is much stronger than yesterday. Concerning the major distribution day, it usually comes out as double instead of single. Once we have the second major distribution day, we have 50% of chance to see a big bounce back, of course another 50% of chance is to get the 3rd major distribution day. Therefore this is not a really bad news.

- 2.0.0 Volatility Index - NYSE (Daily), Bullish Morning Star, so the probability of rising further is very high. Be reminded that this is totally different from the situation yesterday where the market raised but VIX only went down slightly.
- 3.0.3 20 Year Treasury Bond Fund iShares (TLT Daily). Bond is rising madly and overbought. Different from yesterday, the direction of Bond is consistent with the stock market today.


The problem I worried about yesterday showed up today:
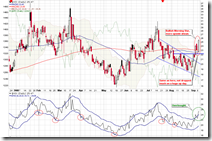
3.1.0 US Dollar Index (Daily), Doji (a cross pattern). US dollar looks exhausted. For the last few times of Doji pattern, the bullish up move was continued. However the Doji today didn't make a new high, which is much more bearish than previous ones. Furthermore, today's candle is a inside bar (the candle is the range of previous candle completely), which has a name called Harami in the candlestick patterns. At the current level with so many overbought signals as well as the negative divergence, the Harami hints that the probability of pullback is high.

3.2.0 Japanese Yen (Daily). The key support on Japanese Yen held well today, and Yen has bounced back from the support. The pattern looks similar to a Bullish Morning Star (not exactly as some people can see), so Yen may rise further tomorrow.

The pair of US dollar and Japanese, one goes up and another goes down. Take into account of Bullish Morning Star on the VIX chart, also considering that there is no significant positive divergence on the intraday charts of major indices, as a result I tend to believe tomorrow the market may be bearish.
Here are few interesting charts.
0.0.1 Simple SPY Trading System. VIX has broken out ENV on the upper side, and it is overbought. However this may not be a sufficient evidence to a rebound according to the above analysis. Note RHNYA is close to oversold region again. Therefore if the market sells off tomorrow, RHNYA will be oversold, and the market might bounce back on the day after tomorrow hopefully. By the way, I guess there will be a patriot rally on September 11th, the day after tomorrow.

2.4.2 NYSE - Issues Advancing. Today it is a new low again. The explanation has been given previously so I won't say again this time. What you should know is that a new low means SPX will likely have a lower close ahead.

1.1.6 PowerShares QQQ Trust (QQQQ Daily), oversold. Some people may "yeah, yeah, yeah!". Well, oversold is oversold.
1.1.B QQQQ and VXN. VXN crossed above ENV and is overbought. So QQQQ has a chance to bounce back.
1.1.C TRINQ Trading Setup. TRINQ is greater than 2 today, which means the market might go up tomorrow. The success rate of this setup is 59% only, just for your information.
1.4.0 S&P/TSX Composite Index (Daily). Take a look at how crazy it is -- Canadian market has plunged for over 1600 points during just a few days. It is oversold, of course. Take notice at ATR at the bottom of the chart, it is very high. Has it bottomed out? Of course I have doubt.

1.4.4 TSE McClellan Oscillator. Another evidence to support that Canadian market is approaching to a bottom is the golden bar of new low spikes, which is one of bottoming characteristics. I am not really convinced at the moment. You may have your own decision to bottom-fishing or not.

3.4.1 United States Oil Fund, LP (USO Daily), oversold.
5.0.2 S&P Sector Bullish Percent Index, note the bottom half of the chart shows that the energy sector is in the buy zone from the perspective of the Bullish Percent Index. It is very close to a ten-year low. Again, do your own due diligence prior to any action.
