There is no concrete conclusion in this report, we have to see how the market goes next week.
We saw a bullish reversal on Thursday, but unfortunately no follow-through showed up on Friday. Many breadth signals (e.g., 1.0.5 Major Accumulation/Distribution Days, 2.4.3 Breadth Oversold/Overbought Watch) indicate that a bottom is highly likely in place, however no chart pattern has confirmed this so far, therefore one should not heavily long or short.
In the next week, the key market behaviors to watch are if the Thursday low SPX 865 will hold, and if Friday high SPX 984 will break out.
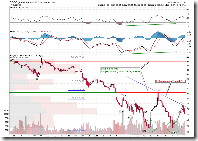
1.0.3 S&P 500 SPDRs (SPY 60 min). During the weekend many people are talking about the symmetrical triangle on the chart. The pattern does look like a symmetrical triangle which means 75% possibility is breakout at the downside. However symmetrical triangles (as well as all trend lines) need a confirmation by the third point, you can see that we can also draw an ascending channel which has no third-point either. Therefore, it is probably too early to talk about the symmetrical triangle. Let's see how the market plays out next week.
1.0.4 S&P 500 SPDRs (SPY 15 min). The selling-off at the end of trading hours on Friday could be considered as a bull flag, which is not too bad. There is a consolidation region near Fib 61.8 which may provide some supports.
1.1.4 PowerShares QQQ Trust (QQQQ 60 min). Just like SPY, the pattern could be either double bottom or descending triangle at this point of time, but the positive divergence on MACD and RSI looks good.
1.4.2 S&P/TSX Composite Index (60 min). MACD and RSI also show positive divergence on the Canadian market.
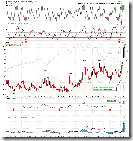
2.0.1 Volatility Index (Weekly). The rally of VIX has lasted for 8 weeks, and VIX is extremely overbought now. Period.
3.0.2 TED Spread. Here is a poor man's TED spread. LIBOR is falling and UST3m is rising. Hopefully this good trend can continue in the next week.


4 Comments