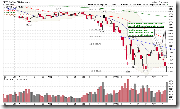
Accordig to Don Worden from Telechart, today is a Key Reversal Day. What he is arguing is as follows:
- It must occur as the latest in a decline of at least several days.
- It must carry into new low ground for that decline.
- It must then rally to a level higher than the previous close. The higher the better.
- It must close with an advance for the day.
- It must close in the upper half of its own range for the day.
- Volume must increase markedly.
There is no guarantee that a Key Reversal Day will kick off a significant rally, of course. But I have found it to be one of the more reliable technical patterns. This could be related to the fact that it occurs relatively rarely (especially in averages as opposed to individual stocks).
Concerning the further development of the market, there are two criterion, and one can refer to 0.0.2 SPY Short-term Trading Signals. Basically it is still what I am talking about recently, three up days and three down days, and see which one has the bigger range. Therefore as late as next Monday, the high point must be higher than 95.53. If it succeeds, then the high point by the next Thursday must be higher than 100.71. If any one of two criterion doesn't meet, bulls would better run away. By the way, many newsletters were still waiting for the potential test of 2002 low until yesterday, so people should keep cautious.
0.0.0 Signal Watch and Daily Highlights. Oversold signals have been corrected today. Major mid-term buy signals are still there, and mid-term breadth signals are still oversold.
3.1.0 US Dollar Index (Daily). Considered the negative divergence, US dollar should pull back further. This means the extremely oversold commodities, especially the crude oil, may due for a pull back.
3.1.1 US Dollar Index (Weekly). On the weekly chart, the US dollar reached the important resistance, and it seems not so easy to break out considered the oversold situations.
Here is an excerpt from today's Market Message by John Murphy, and he also thinks the commodities are due for rebound:
Chart 5 shows the Energy SPDR (XLE) beginning today's upside reversal from above its October low. That has created a short-term positive divergence between it and the price of crude (solid line). Given oil's close correlation to the stock market, oil (and most other commodities) should finally experience an overdue relief rally.


7 Comments