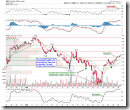
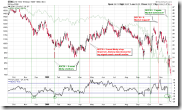
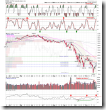
Over the short term, the market is overbought, and may pullback at some point in the next week. Over the intermediate term, an encouraging signal appeared on Friday. Of course, the signal needs to be confirmed by the location where the pullback finishes, and it has to be a higher low.
0.0.2 SPY Short-term Trading Signals. NYADV and NYMO, which are used to be quite accurate, are overbought now. Yes, Market may ignore these overbought signals temporarily, however do anyone really believe that NYADV will stay at overbought level and never come down?
1.0.3 S&P 500 SPDRs (SPY 60 min), RSI is overbought. As mentioned in the past, RSI overbought/oversold on the 60-min chart is quite accurate.
1.0.4 S&P 500 SPDRs (SPY 15 min), 1.1.6 PowerShares QQQ Trust (QQQQ 15 min), Bearish Rising Wedge, MACD and RSI show negative divergence.
As a summary, I believe a pullback is due in the short term.
0.0.3 SPX Intermediate-term Trading Signals. NYSI buy signal. So far, all mid-term signals are buy.
2.3.4 Nasdaq Total Volume/NYSE Total Volume. Spike low, it looks very encouraging and like a bottom. Last time of spike low is March, and then the market rallied for two months.
3.0.0 10Y T-Bill Yield. Yield is dropping down continuously, which looks encouraging too.
Because of 2.3.4 and 3.0.0 signals, the mid-term outlook should be promising.
1.4.0 S&P/TSX Composite Index (Daily). The Canadian market is overbought.


2 Comments