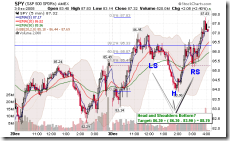
Today the market looks quite bullish, but I am not entirely satisfied because two up days failed to cover the loss on Monday. On the 5-min charts of SPY and QQQQ the pattern looks like a head and shoulders bottom, or at least a cup with handle, furthermore there is no significant overbought signals in the short term, bulls might have a chance tomorrow.
0.0.0 Signal Watch and Daily Highlights. On the overview of all signals, mid-term ones are green, short-terms are surprisingly neutral except for overbought NYMO. Under this scenario, I would rather rely on patterns and tend to believe bulls have a chance tomorrow according to head and shoulders bottom. Over the intermediate term, I think the trend is up according to signals and the basic strategy is to buy dip. However, no clear buyable dip signal showed up in recent two days based on 8.1.1 Buyable Pullback Rule.
0.0.2 SPY Short-term Trading Signals. Take a look at the follow chart and see why I am not satisfied. Today's candle isn't small and not a bearish one either, thus I have no concrete conclusion. By the way, two inside bars are like a compressed string, no matter which direction it bursts out it would be dramatic.
1.0.3 S&P 500 SPDRs (SPY 60 min). You may see a big head and shoulders bottom, and the small one is located at the top right corner where the blue circle marks.
2.1.0 S&P 500 SPDRs (SPY 5 min). Again, a small head and shoulders bottom. Neckline might not be convincible, but cup with handle patten should also work which is a continuation pattern.
1.3.7 Russell 3000 Dominant Price-Volume Relationships, 1163 stocks price up volume down, not a good news.
3.0.3 20 Year Treasury Bond Fund iShares (TLT Daily). TLT rallied again, and it's overbought, plus volume declined for three days, plus doji today, it might want to take a rest which is bullish to the stock market.
3.2.0 CurrencyShares Japanese Yen Trust (FXY Daily). Japanese Yen may also pull back which is bullish to the stock market.
3.4.1 United States Oil Fund, LP (USO Daily). Note the green dashed line, every time STO reaches there it will bounce back. Furthermore, the sell volume is magnifying which also means an exhaustion in some extent. Therefore the crude oil may possibly bounce back, which is bullish to the stock market.
As a summary, over the short-term odd may be at bulls' side.
1.4.3 S&P/TSX Composite Index (15 min). Canadian market looks like a double bottom. If crude oil bounces back, TSX may follow as well.


