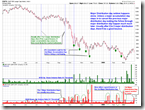
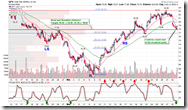
The breakdown of SPX 791 today means that for 2 down days bears have completely recovered the previous 2 up days, therefore 2 vs 2 bears won. This is to say that it’s very likely that the uptrend has now reversed. Bulls still have hopes though. See the following chart, if by Wednesday, the low of the SPX is higher than 766, then the uptrend is still valid. Nevertheless, the bigger picture, because now it’s almost impossible for bulls to push SPX above 875 within 2 days, therefore 18 vs 18, the strength of the rebound is weaker than the strength of sell off, this means we are still in the bear market while the primary trend is still pointing down. For people who are new to the n vs n rule, please refer to 7.2.1 Buyable Pullback Rule and verify the effectiveness of this rule for pinpointing the trend change. In fact, this is very similar with the preliminary Dow theory for checking the trend based on higher high and lower low, while in my way the time is factored in.
2.4.2 NYSE - Issues Advancing. Lower low on this chart means that SPX should at least have a lower close ahead than today’s close at 787.
1.0.5 Major Accumulation/Distribution Days. Today is a major distribution day, which means the market may not have any decent rebound before making another major distribution day providing that there is no major accumulation day in the near term.
0.0.3 SPX Intermediate-term Trading Signal, 1.1.4 Nasdaq 100 Index Intermediate-term Trading Signals. STO is still overbought regardless of two down days in a row.
1.3.7 Russell 3000 Dominant Price-Volume Relationships. Some people claim that recent down accompanies with lower volume and thus should be deemed as bullish. Well, in the bear market price down volume down is actually a continuation pattern which is surely not bullish. Anyway, 1389 stocks price down volume up today in Russell 3000, and this is not lower volume at all.
As what you can see, the market condition does not favor bulls for now, however hopefully the market could bounce back up in the very short term.
1.0.2 S&P 500 SPDRs (SPY 60 min). STO is oversold, and the pattern also looks like a kiss back to the neck line of the head and shoulders pattern after the breakout.
1.0.4 S&P 500 SPDRs (SPY 15 min). Quite a few positive divergence so a rebound is hopeful.


5 Comments