Firstly I would like to correct a mistake: yesterday I said bears won 2 vs 2 so the uptrend was weakening, and this would not be changed even if SPX broke out 833. This is incorrect. The method of N vs N is based on the Dow theory, therefore a higher high has cancelled the previous 2 vs 2, which means the market action today confirms that the uptrend is still intact. Compare the current scenario with 8.0.3 Use n vs n Rule to Identify a Trend Change 2008, there is no higher high every time the uptrend is changed to the downtrend (marked with red circles).
7.1.0 Use n vs n Rule to Identify a Trend Change. Since N vs N will be recounted, should the market pull back tomorrow which is the earliest possible time, bears will have three days to make lower low based on this rule. Then with the assumption that bulls fail to make a higher high within three days, we will need 6 days to confirm the trend change. Sorry to bears, this is the least amount of time you have to fight back.
Besides the judgment of trend change, N vs N rule can also assist to decide whether to buy dip or sell bounce. For this use, please refer to 7.2.1 Buyable Pullback Rule.
Today’s higher high also cancelled two predictions which favored bears.
1.0.5 Major Accumulation/Distribution Days. Today is a major accumulation day, so we won’t expect the second major distribution day in the short term.
2.4.2 NYSE - Issues Advancing. The assertion of SPX lower close ahead is invalid now because SPX has made a higher high. By the way, the negative divergence on NYADV is an essential step prior to a market top.
Over the short-term, there are a couple of overbought signals so a pullback is due. On the other hand, none of them are at the extreme level so I am not sure if the market will pullback from tomorrow.
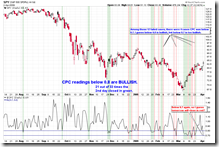
7.0.4 Extreme CPC Readings Watch, CPC is below 0.8 again, 64% of the chance is to close in green tomorrow. However, recently when CPC was below 0.7 the next day was unpleasant so I am unclear if this time CPC means normal bullish instead of over bullish. In addition, 7.3.2 Firework Trading Setup is put aside intentionally because the only time when the firework failed the CPC was below 0.7.
5.0.1 S&P Sector SPDRs. Today’s rally should thank to the good news from the financial sector. However XLF is lagging behind. The continuation of this trend, if it does, is bearish to the broad market.
0.0.2 SPY Short-term Trading Signals. Quite a lot of overbought signals, especially NYMO is quite accurate.
1.1.4 Nasdaq 100 Index Intermediate-term Trading Signals. NYDXA50R is so high that it even seems like a bull market.
T2103 from Telechart, Zweig Breadth Thrust, which is equivalent to NYADV/(NYADV+NYDEC) then take a 10-day moving average. I notice that the overbought of this indicator is very accurate, every time it happens the market pulls back on the next day.
T2122 from Telechart, NYSE 4 week New High/Low Ratio, is now overbought.


18 Comments