Summary:
Could be more rebound at least tomorrow morning.
More signals confirming an intermediate-term top.
| Trend | Momentum | Comments - Sample for using the trend table. | |
| Long-term | Down | Idea for trading intermediate-term under primary down trend. | |
| Intermediate | Down | Neutral | |
| Short-term | Down* | Neutral |
I consider today’s drop as a follow-through of the yesterday’s Bearish Reversal. With more intermediate-term sell signals triggered and more potential topping signals, it does not look good for bulls. Very short –term, because of oversold plus a few positive divergences, so there could be more rebound at least tomorrow morning.
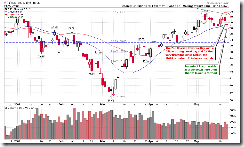
1.0.3 S&P 500 SPDRs (SPY 30 min), this is my main reason for the tomorrow’s rebound, oversold plus lots of positive divergences. (Noticed a potential Double Top could be in the forming. But without a breakdown bellow the neckline to confirm this indeed is a Double Top pattern, it’s not a reason to be bearish though.)
0.0.0 Signal Watch and Daily Highlights, this is the overall signals for my chart book at www.stockcharts.com. The trend following indicators are all yelling for sale, either short-term or intermediate-term. While on the other hand, all the momentum indicators are mostly deadly neutral, so I expect more pullbacks ahead. 1.3.7 Russell 3000 Dominant Price-Volume Relationships, 1501 stocks price down volume down, this is a typical continuation pattern in the bear market, so it supports for more pullback as well.
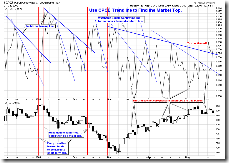
2.8.0 CBOE Options Equity Put/Call Ratio, double confirming line was broken today confirming a potential market top. This signal, ever since I found “the trend line rule” since year 2007, only went wrong once (04/20/2009 Market Recap: The rally might be over). But last time when it went wrong, it was without 2.8.3 SPX:CPCE’s confirmation. This time, however, both 2.8.0 and 2.8.3 have confirmed.
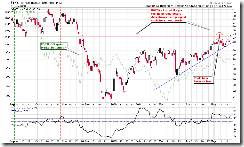
1.2.0 INDU Leads Market, INDU made a lower low today, if the past pattern illustrated on the chart still holds true then SPX will follow soon.
The following charts are for your info only:
3.1.1 PowerShares DB US Dollar Index Bullish Fund (UUP 30 min), RSI oversold plus lots of positive divergence, US$ may rebound, it’s not good for the stock market.
3.0.0 10Y T-Bill Yield, just to remind you that when yield rises, not only the stock market could be topped but also means a possible higher mortgage rate.
Performance Surrounding Memorial Day from www.sentimentrader.com.


9 Comments