|
||||||||||||||||||||||||
|
||||||||||||||||||||||||
|
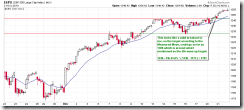
SHORT-TERM: CPCE TOP SIGNAL CONFIRMED
No more excuse, the breakout yesterday is confirmed today, so according to the Measured Move, the SPX could go as far as 1291. Personally, I don’t believe this target, however, no matter how many reliable bearish signals, as long as the price action doesn’t confirm, being a bear is a dangerous job, so let’s just wait and see (and in addition I give bear my most sincere moral support). The bottom line, as I said before, whenever you see me “has to” hold both long and short overnight (see short-term session in the table above), it’s probably the time at least to reduce the long position.
Nothing else to say. The CPCE top signal mentioned yesterday is confirmed. At the current stage, I really don’t know if it works or not (Sorry, I know I’m not supposed to comment like this. Well, considering the comment as extra credit for the top signal, if you like). Purely from seasonality point of view, until the year end, only 2 days have some hopes for bears, the 12/23 and the 12/31.
INTERMEDIATE-TERM: COULD BE WAVE 5 UP TO SPX 1300+, PIVOT TOP COULD BE AROUND 01/05 TO 01/12
See 12/17 Market Recap for more details.
SEASONALITY: NO UPDATE
See 12/03 Market Recap for December seasonality chart.
HIGHLIGHTS OF THE OTHER ETFS IN MY PUBLIC CHART LIST
| SIGNAL | COMMENT | |
| QQQQ | *12/21 L | |
| NDX Weekly | UP | |
| IWM | ||
| IWM Weekly | UP | |
| CHINA | ||
| CHINA Weekly | UP | |
| EEM | ||
| EEM Weekly | UP | |
| XIU.TO | 12/02 L | |
| XIU.TO Weekly | UP | |
| TLT | ||
| TLT Weekly | DOWN | |
| FXE | ||
| FXE Weekly | DOWN | |
| GLD | ||
| GLD Weekly | UP | |
| GDX | 12/17 S | |
| GDX Weekly | UP | |
| USO | Could be a Pennant in the forming, so more push up? | |
| WTIC Weekly | UP | |
| XLE | 06/15 L | |
| XLE Weekly | UP | |
| XLF | 10/15 L | |
| XLF Weekly | UP | |
| IYR | ||
| IYR Weekly | UP | Home builders are lagging. |
| XLB | 12/01 L | |
| XLB Weekly | UP | BPMATE is way too overbought. |
- Please make sure you understand how to use the table above. The purpose of this report is to provide info so contradictory signals are always presented.
- Position reported in short-term session of the table above is for short-term model only, I may or may not hold other positions which will not be disclosed.
- Conclusions can be confirmed endlessly, but trading wise, you have to take actions at certain risk level as soon as you feel the confirmation is enough. There’s no way for me to adapt to different risk levels therefore no trading signals will be given in this report except the mechanical signals such as SPY ST Model.
- * = New update; Blue Text = Link to a chart in my public chart list.
- Trading signals in OTHER ETFs table are mechanical signals. See HERE for back test results. 08/31 L, for example, means Long on 08/31.
- UP = Intermediate-term uptrend. Set when I see at least one higher high and higher low on weekly chart.
- DOWN = Intermediate-term downtrend. Set when I see at least one lower high and lower low on weekly chart.


