The purpose of this post is to keep track of my progress on optimizing stock screeners I’ve been using for many years.
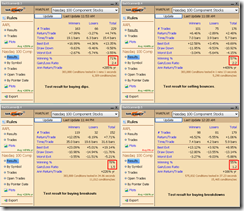
Basically, for long candidates I search very strong stocks and try to buy them when a bullish reversal bar is formed on a way of a bigger pullback; For short candidates I search very strong downtrend stocks and try to short them when a bearish reversal bar is formed on a way of a bigger bounce. I have screener to search breakout on volume surge for long and breakdown on volume increase for short too. But I found generally, if without manually pick up the screen results, buy dip/sell bounce setup is marginally better. The manual pickup requires experiences and besides psychologically most people aren’t comfortable in chasing high or selling low. So personally I feel perhaps it’s better to focus on screeners for buying dips and selling bounces. The chart below illustrates the back test result. As I don’t have super super powerful machine (Intel Core 2 Quad CPU shouldn’t be very bad, should it? So what more can I ask?), so testing on all stocks takes more than an hour so I have to use Nasdaq 100 components for testing each optimizing conditions to save time. Not perfect, but that’s the reality.
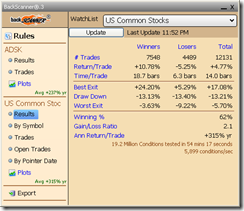
Below is the current back test for buying dip/selling bounce for all the stocks trading on the market. The results are not as good as that of Nasdaq 100, but not very bad I think.
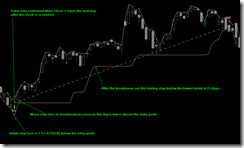
And below are how the stop loss is automatically adjusted for the back test. Use them as general guidance for trading buying dip/selling bounce screeners.


