SHORT-TERM: EXPECT REBOUND SOON, BUT REBOUND, IF ANY, IS SELL
Thee conclusions:
- Rebound, as early as tomorrow, no later than 3 trading days. The rebound size might not be small.
- Rebound, if any, is sell.
- Ironically, a red close tomorrow is actually good for bulls.
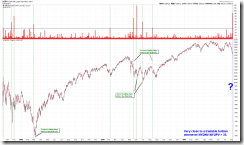
Everyone knows the market is oversold, therefore a rebound is just a matter of time. The question is when? My guess is tomorrow the earliest or no later than 3 trading days. The chart below is my main witness. NYSE Down Volume to NYSE Up Volume Ratio >= 35, seems a tradable bottom within 3 trading days.
Listed below are all the other heavy weight evidences arguing for a rebound. They’re no ordinary signals therefore are more reliable.
- Usually a huge rebound after 3 Major Distribution Days. This even worked in year 2008, perhaps at that time was the only chart that worked, so very reliable.
- NYMO extremely oversold.
- Too many Sentimentrader Indicators are arguing for a rebound.
- As mentioned in today’s Trading Signals, VIX rose 18%+ means 77% chances a green day tomorrow.
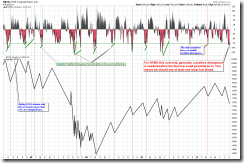
Why, rebound if any, is sell? I’ve been blah blah this for quite a time. It’s the law of inertia, NYMO new low means the downward movements are still accelerating, therefore very hard to reverse immediately. A visible NYMO positive divergence implies, a sizeable rebound then lower low while at the same time no new low on NYMO.
The chart below is another reason for sell, if rebound right away tomorrow, a SPX lower close is almost guaranteed.
Why is a red tomorrow good for bulls? See chart below, a red Non Farm Payroll day tomorrow usually means a reversal which in the current case should mean a reverse up.
The last but not the least, a reminder, a typical Non Farm Payroll day intraday pattern is open high go lower or open low go higher. The chart below is from Bespoke.
INTERMEDIATE-TERM: IN DOWNTREND, HEAD AND SHOULDERS TOP, TARGETING SEP 2010 LOWS
See 08/03 Market Outlook for more details.
SEASONALITY: BEARISH FIRST 9 TRADING DAYS OF AUGUST
See 07/29 Market Outlook for more details. Also please see 07/29 Market Outlook for day to day August seasonality chart.
ACTIVE BULLISH OUTLOOKS:
08/03 Market Outlook: A tradable bottom might be in, targetingMA(200) above.Failed!
ACTIVE BEARISH OUTLOOKS:
- 08/01 Market Outlook: Rebound, if any, is sell. Also so 08/02 Market Outlook for more evidences.
SUMMARY OF SIGNALS FOR MY PUBLIC CHART LIST:
|
|||||||||||||||||||||||||||||||||||||||||||||
|
|||||||||||||||||||||||||||||||||||||||||||||
|


