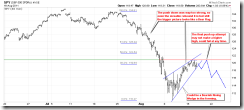
SHORT-TERM: IN WAIT AND SEE MODE
No conclusion today, need see tomorrow. According to the 7-Day Rule, since we had a down day today, so this means absolutely no red day for the rest 3 days, otherwise we’ll have another evidence arguing what we had till now is merely a rebound.
QQQ Hollow Red Bar could mean a top of some kind, need see tomorrow as well.
The chart below is my wild-est-est-est guess about what's going on the next (subject to change at any time of course). The main theory is still the rebound looks like a Bear Flag or Pennant, therefore at least the 08/09 lows will be revisited eventually.
INTERMEDIATE-TERM: CONCEPT ONLY, THE WORSE CASE SPX DOWNSIDE TARGET IS 1,000
See 08/05 Market Outlook for more details.
SEASONALITY: BULLISH MONDAY AND FRIDAY
According to Stock Trader’s Almanac:
- Monday before August expiration, Dow up 11 of last 15.
- August expiration day bullish lately, Dow up 7 in a row 2003 – 2009.
ACTIVE BULLISH OUTLOOKS:
08/04 Market Outlook: Relief rally could be within 3 trading days.
ACTIVE BEARISH OUTLOOKS:
- 08/02 Market Outlook, 08/05 Market Outlook, 08/08 Market Outlook, 08/09 Market Outlook: Rebound, if any, is sell.
SUMMARY OF SIGNALS FOR MY PUBLIC CHART LIST:
|
|||||||||||||||||||||||||||||||||||||||||||||
|
|||||||||||||||||||||||||||||||||||||||||||||
|


