Firstly, I am sorry to tell you that today does not look like a reversal day. Although the steady rally in the middle of the day was a bit alike, the selling off near the end of trading hours confirmed my feeling that it is not. Moreover, the plummet in the early morning was not deep enough to panic the traders. In addition, I did not get a notification from StockCharts Realtime which informs customers to minimize the use of 15-second auto fresh. Again, on the reversal day the rally will be steady and like a wave, not those rapid ones in these days which scare many bears.
3.1.0 US Dollar Index (Daily). Today the US dollar was weak and almost broke the head and shoulders top. On 3.2.0 Japanese Yen (Daily) the resistance has been broken and this caused 3.2.3 US Dollar/Japanese Yen Ratio broke downward. As you can see from the following chart, where the black/red lines denotes $USD:$XJY and the green lines denotes the market, Yen outperforms USD is bearish to the market. To make it even worse, the ratio is just started to drop down!

3.2.4 Yen RSI and the Market Bottom. If the US dollar is continuously weakening, the market may not be bottomed out before the RSI(14) of Yen is deeply oversold. Pay attention to the relationship between the RSI (black line) and the market (green line).

0.0.8 TRINQ Trading Setup. The probability of QQQQ going down tomorrow is about 80%, as shown TRINQ which closed below 0.6. In my opinion, this trading setup is fairly accurate.

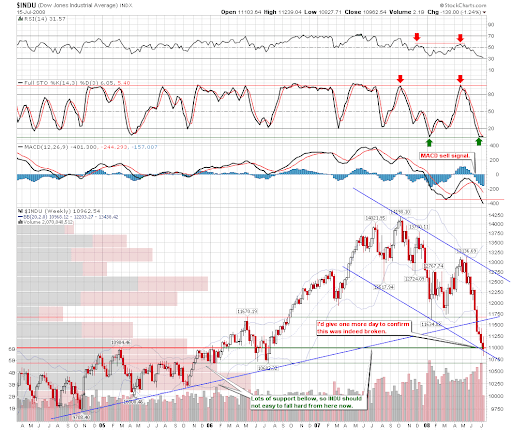
1.2.1 Dow Jones Industrial Average (weekly). An important and significant support region has been broken today. Well, the breakout does not look extremely obvious so let's see how it goes tomorrow.
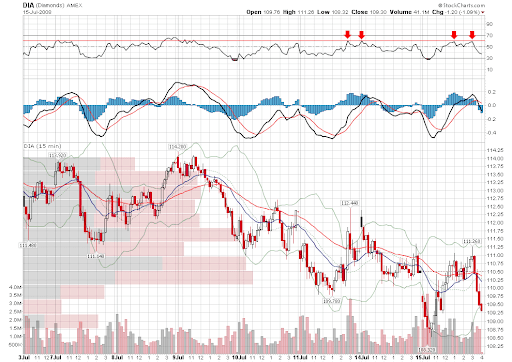
1.0.7 S&P 500 SPDRs (SPY 15 min), 1.2.7 Diamonds (DIA 15 min), 1.3.6 Russell 2000 iShares (IWM 15 min). Tomorrow they will either go up or reverse in the mid-day. Note that the resistance on the RSI has been successfully validated several times.
1.4.0 S&P/TSX Composite Index (Daily). The symmetric triangle pattern on the Canadian market was broken. 1.4.2 S&P/TSX Composite Index (60 min), 60-min chart has nothing new but breakdown, test back breakout point, and fall down again.
3.4.1 United States Oil Fund, LP (USO Daily). The oil plummeted, but closed on the trend support. 3.4.3 United States Oil Fund, LP (USO 60 min), that consolidation region at the left side should provide a strong support, tomorrow we will see.
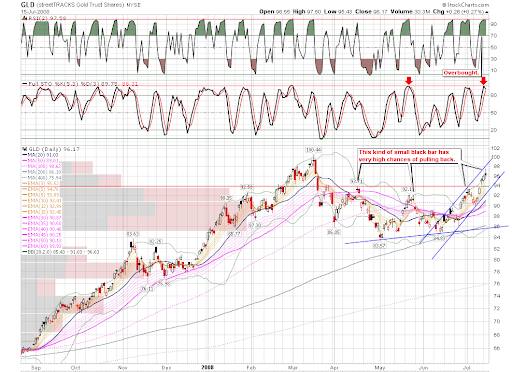
3.3.0 streetTRACK Gold Trust Shares (GLD Daily). The gold is overbought. Another black candle today, which has relatively high probability of pullback. Gold is good, but I've never touched it and don't know how it feels 😉