I am quite surprised to the Friday big rally. However I have not found any signals to prove the market may have topped although I have looked though all my indicators. Thus I suppose the market is strong so far, and the good strategy is to buy on low while risky one is to short on high. My point is there will usually be a climax run prior to the trend reversal. The market may only be topped when it keeps going up for 4 days regardless of the sentiment. If we still see the pullback in the next week, the market is still healthy and it will be a good chance to buy dip.
Will the market pullback next week?
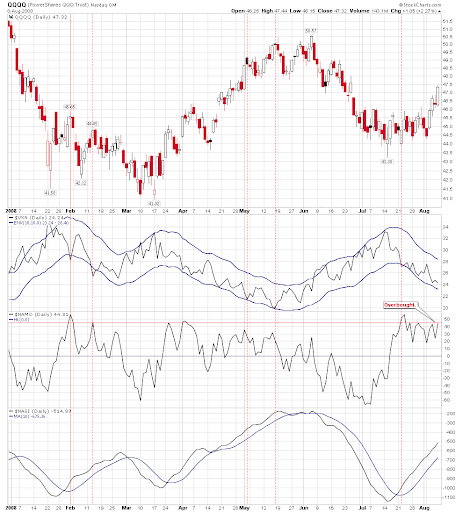
1.1.B QQQQ and VXN. The old friend NAMO is overbought again and due for pullback.
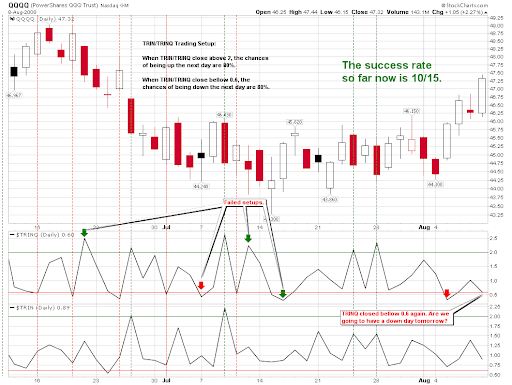
1.1.C TRINQ Trading Setup. TRINQ closed at 0.6 last Friday, so the next Monday may be down. So far the success rate is 10/15 and it still has an edge.
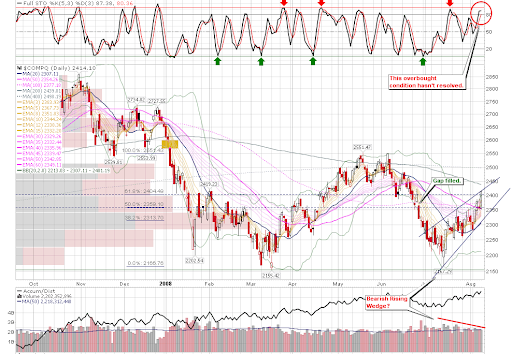
1.1.0 Nasdaq Composite (Daily). It is a Bearish Rising Wedge, and STO is overbought.
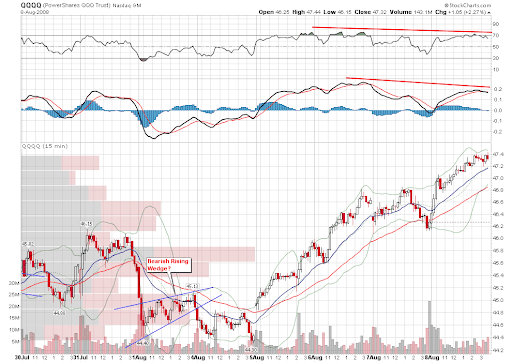
1.1.A PowerShares QQQ Trust (QQQQ 15 min). Both MACD and RSI show negative divergence.
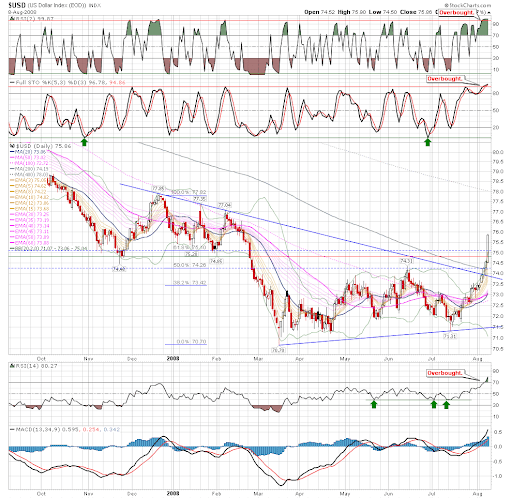
3.1.0 US Dollar Index (Daily). This is why the market was so strong last Friday. However US dollar is overbought, and both RSI and STO have reached a record high level.
As a summary I think the market will likely have a pullback in the short term.
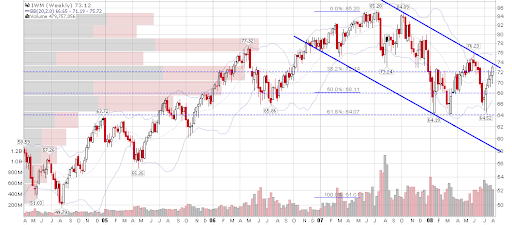
1.3.1 Russell 2000 iShares (IWM Weekly). Although it has proven to be wrong to short QQQQ as a hedge, long IWM is so far so good. IWM is the best among major indices. But after five weeks of rally, it is very close to up channel. Be cautious.
3.3.0 streetTRACKS Gold Trust Shares (GLD Daily). GLD is testing an important support line.

3.4.2 United States Oil Fund, LP (USO Weekly). The oil is also on an important support.

3.4.3 United States Oil Fund, LP (USO 60 min). The pattern looks like a Bullish Falling Wedge. In addition, MACD and RSI show positive divergence.
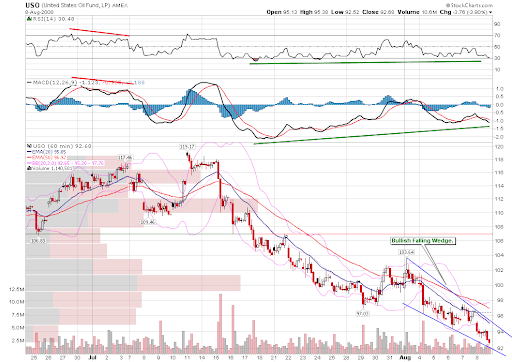
Whether or not the oil bounce back at the current level has a big impact to the stock market. Given the complex political situation I don't know where the oil price will go. Let's wait for a few more days.
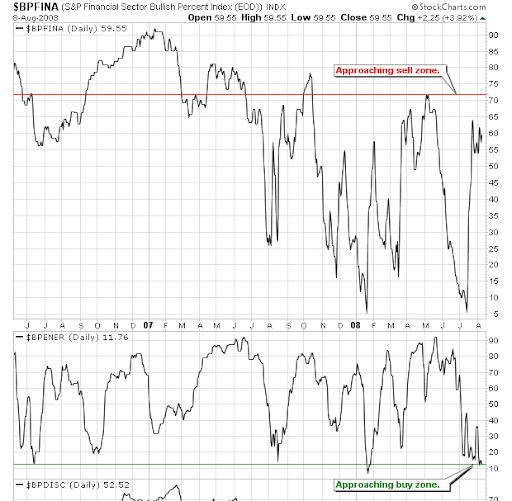
1.0.7 Sector Bullish Percent Index. This is a new chart, at the moment it is not a concern and I just want to have your attention. $BPENER shows the energy sector is very close to the buy zone, but $BPFINA means the financial sector is approaching previous sell zone. As a result, the market will go down soon or later.
2 Comments