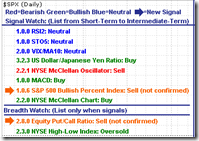
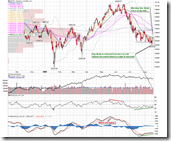
Support on major indices holds well today. 2.8.0 CBOE Options Equity Put/Call Ratio mentioned yesterday is not confirmed. By the way, you may refer to 0.0.0 Signal Watch and Daily Highlights for the up-to-date signals and status of markets any time, and I also put a short summary on the chart.
Based on the trend strength analysis by looking at two days up two days down, tomorrow the market has to go up significantly to fix the damage caused by recent selling-off. The candle today is similar to the one yesterday, and it is considered as consolidation. Therefore if the consolidation region is broken downward tomorrow, the situation will be very bearish because it means the downtrend momentum is very strong. Under this situation the short-term oversold signals usually don't work, so you may short no matter how oversold the indicators are. Just remember that this is a theoretical strategy but not a trading advice.
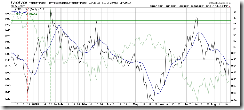
2.0.2 Volatility Index 30-day/90-day Ratio. If the market indeed goes up dramatically, keep an eye on this chart. If VIX plunges heavily, the chart may give a market top signal. The history of this chart isn't very long, but so far the market top and bottom signals are all correct. Therefore we should not overlook it.
2.3.0 NYSE High-Low Index. If the market plunges tomorrow, don't to be too nervous. Since this chart is very close to the oversold region, I think we can still look forward a rebound in the near term.
The summary is... no conclusion 🙂 How Mr Market solves the aforementioned issues is an open question at the time being, let's go and see. According to my climax run theory, I guess the market may rally for a few days at a slow and moderate pace, then go above 1320 to squeeze the bears and trap some small bulls. At the same time, VIX:VXN gives a sell signal, then the market goes south. Well, remember this is just a guess.
1.1.6 PowerShares QQQ Trust (QQQQ Daily), 1.3.0 Russell 2000 iShares (IWM Daily). Black candle again, high probablity of reversal. Note that QQQQ daily chart shows a double gold at the bottom, which can be considered as a mid-term sell signal. By the way this double gold also shows up on 1.0.0 S&P 500 Large Cap Index (Daily).
1.1.A PowerShares QQQ Trust (QQQQ 15 min), 1.3.6 Russell 2000 iShares (IWM 15 min). MACD and RSI show positive divergence, which means a high probability of rebound.
3.0.3 20 Year Treasury Bond Fund iShares (TLT Daily). The resistance has been tested for three days, and today it closed as a Doji, additionally STO is still in the overbought region, therefore I believe the bond may go down which is bullish to the stock market.
5.0.1 Select Sector SPDRs, support holds, good. I have told the pattern yesterday -- it may go up for two days. Let's see if it does or not.
Conclusion is, tomorrow the rebound may continue.
1.4.0 S&P/TSX Composite Index (Daily). Canada market seems pretty bullish, Evening Star, moreover MACD and RSI show positive divergence. The chance of going up is big. However I have not figured out how Canada market could go up if US market goes down? The only explanation is the oil will likely soar. Of course another possibility is US market might keep bullish for a few more days.


2 Comments