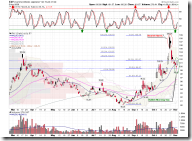
Although the pullback today might be bigger than estimated, it is well expected considered the 6 days in a row and the remarkable negative divergence between price and volume. At the moment I tend to be consider the mid-term trend bullish, while the pullback might continue in the short term because the overbought signals have not completed corrected.
0.0.3 SPX Intermediate-term Trading Signals. I use the signals on the following chart to judge the mid-term trend. If most signals are buy, the game still is "buy dip". Of course, this doesn't mean one should rush in to buy dip if the market drops down for another 500 points.
0.0.2 SPY Short-term Trading Signals. Concerning the short term, NYADV and NYMO are close to overbought, and the correction isn't sufficient so far. If the market goes up since tomorrow, it will be soon due for another pullback. So my conclusion is that the pullback may continue, and it will be considered as healthy unless it is too violent. On the other hand, it is not good if the market rises tomorrow because the market will be overbought again.
1.0.3 S&P 500 SPDRs (SPY 60 min). Usually the pullback target is at least Fib 38.2% and more often at Fib 50, which means 92.40 in this case.
1.0.4 S&P 500 SPDRs (SPY 15 min). RSI shows that the market is oversold in the short term. However you may notice that prior to a decent rally RSI and MACD will usually form a positive divergence. Today RSI just entered into the oversold region and has no chance to form a positive divergence yet. So the market might bounce back slightly in the morning and fall back down eventually for form a price bar lower low, RSI higher low, which is a pattern of positive divergence before the bounce back.
3.2.0 CurrencyShares Japanese Yen Trust (FXY Daily). Bullish Morning Star is fairly accurate in candlestick patterns. So Yen may bounce back which is bearish to the stock market, and this means the stock market may pull back further.


