My view on TSX has only 2 charts.
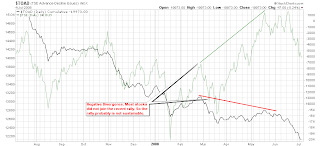
2.4.4 TSE Advance-Decline Issues (Daily), while TSX was making a new high, the breadth was making a new low. This means only a few stocks were up and up while the majorities were down and down.
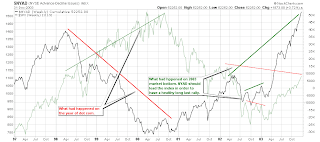
8.0.7 NYSE Advance-Decline Issues 1997-2003. Look at year 1999 to 2000. Exactly the same thing happened, NYSE was making a new high while the breadth was going down. Look at what had happened after year 2000.
I think TSX is about to repeat the history.

5 Comments