| Trend | Momentum | Comments - Sample for using the trend table. Warning: This is NOT a trading recommendation! | |
| Long-term | Down | Idea for trading intermediate-term under primary down trend. | |
| Intermediate | Up | Overbought | Beware of $NYA50R which usually means a top |
| Short-term | Up | Neutral to overbought | May need take profit if further up tomorrow |
| Report Focused On | Buyable dip or the market topped? |
| Today’s Summary | Expect a pullback coming soon. Expect a range bounded market in the coming few weeks. |
CPC closed below 0.8 on the Friday, thus 65% of the chance the market could close in green on Monday according to 7.0.4 Extreme CPC Readings Watch. However, this time I am not sure because:
- 2.8.0 CBOE Options Equity Put/Call Ratio, way too bullish. Recently if CPCE dropped below the red horizontal line, the second day wasn’t very pleasant.

- T2103 from Telechart, Zweig Breadth Thrust. Regardless of its meaning, the overbought of this signal seems accurate on the chart.

- 2.4.4 NYSE McClellan Oscillator is overbought, and the overbought of NYMO is also quite accurate. Also pay attention to the negative divergence on chart, period.

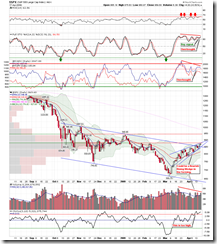
- 1.0.4 S&P 500 SPDRs (SPY 15 min). The bearish rising wedge was mentioned on the Thursday report, however it was immature at the time. Now it looks better and with helps from a few negative divergences.

- 1.0.2 S&P 500 SPDRs (SPY 60 min), this chart looks really bearish. My opinion is still that the potential pullback in the near term would be decent.

In summary I tend to believe the market starts to pullback on Monday. If it does not, pay attention to aforementioned conditions. If they do not get corrected, turnaround Tuesday is almost a sure thing. Therefore the suggestion is to take profit, or at least no chasing high on Monday.
In the intermediate term, we still see overbought plus negative divergence plus several weekly indicators are at a level where a correction usually happened in the past. During the following several weeks, I think the market may seesaw at the current level, therefore buy dip and sell bounce will be the game, instead of simple buy dip like what happened in the past six weeks.
2.8.2 Normalized CPCI:CPCE. Pay attention to the rising CPCI. Index options is not a trading vehicle for retail traders like us, if CPCI is dramatically different from CPCE, it means fund managers are hedging their positions. My question is that since it seems that everyone is talking about a bottom, why fund managers are doing this? Of course I don’t mean the market is topped, what I want to emphasis is the risk – expecting increased volatilities in the coming few weeks.
0.0.3 SPX Intermediate-term Trading Signals.
SPX Breadth from www.sentimentrader.com.
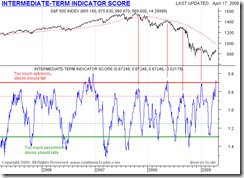
Intermediate-term Indicator Score, the primary intermediate-term trading model from www.sentimentrader.com.
7.3.0 SPX Long-term Trading Signals. For the bear market rebound (I wonder if anyone agrees if this is still a bear market), the potential target is usually MA200. Now NYAD has reached MA200 ahead of its correspondent NYA index.
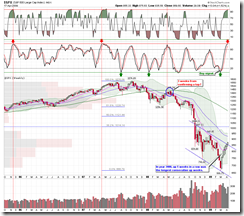
1.0.0 S&P 500 Large Cap Index (Weekly). STO is at such a level which is rare even in a bull market.
2.0.1 Volatility Index (Weekly). The current level of STO usually means a top is coming.


16 Comments