| Trend | Momentum | Comments - Sample for using the trend table. Warning: This is NOT a trading recommendation! | |
| Long-term | Down | Idea for trading intermediate-term under primary down trend. | |
| Intermediate | Up | Overbought | According to $NYA50R, market might be topped. |
| Short-term | Up | Neutral |
| Report Focused On | Buyable dip or the market topped? |
| Today’s Summary |
Expect a pullback as early as Monday. Some warning charts. Some sentiment charts, mean nothing however if it's the start of a bull market. |
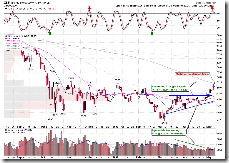
1.0.2 S&P 500 SPDRs (SPY 60 min), with 7 unfilled gaps, if without any pullback, I won’t add any long positions here. Although I’m not a believer of the “gap must be filled”, but 7 gaps are too many according to the “SPY history”.
Short-term, I expect a pullback as early as Monday. Intermediate-term, I’ll show some charts in this report, which if this is still a bear market rally, then they are probably arguing for a turning point, but if this is the start of a bull market, then they may mean nothing. Well, is this a bull market? Personally, I don’t believe it. But I’m a “pure” TAer and there’s a saying if a so called “pure” TAer begins to talk FA or whatever A, then he’s likely out of excuses to support his wishful thinking, so to pretend that I’m not “wishful thinking”, I won’t talk any other A here. Just for trading consideration, I suggest paying attention to the following 2 charts.
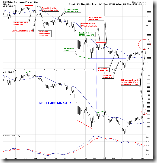
0.0.3 SPX Intermediate-term Trading Signals, without any intermediate-term sell signal, I’d think twice of being heavily short.
Institutional Buying and Selling Trending from www.stocktiming.com, institution accumulation > institution distribution. Again, be careful of shorting.
OK, now my excuses for a short-term pullback:
T2103 from Telechart, Zweig Breadth Thrust, overbought again and I trust this chart.
T2112 from Telechart, % stocks trading 2 standard deviation above their 40-day moving average, record new high again, I don’t believe it can long last. What kind of market is it when 56% NYSE stocks are at their BB up boundary?
3.1.1 PowerShares DB US Dollar Index Bullish Fund (UUP 30 min), ChiOsc at bottom is way too low, so I believe that US$ will rebound and this is not good for the commodity and therefore commodity related sectors such as XLE. 5.2.0 Energy Select Sector SPDR (XLE Daily), XLE by the way, there’re multiple resistances ahead plus the target of Ascending Triangle is almost met, so it’s like to pullback. This also applies to Canadian market which is heavily weighted with energy related stocks, and also pay attention to 7.4.4 TSE McClellan Oscillator, McClellan Oscillator overbought plus negative divergence.
Some warnings bellow:
1.1.0 Nasdaq Composite (Daily), stalled at MA200 plus SOX began to underperform. 1.1.1 Nasdaq Composite (Weekly), weekly chart doesn’t look good either. Nasdaq has been a leader since the March rally, now it’s weakening, I think we should pay attention to this situation from now on.
1.2.0 INDU Leads Market, SPX is just a hair away from the Jan high while INDU is till far far away from its Jan high, if the past pattern still holds true this time, I don’t think this kind of divergence is a good sign.
3.0.0 10Y T-Bill Yield, after being given a top signal now it formed a reversal day under an important resistance. This might mean something significant so be aware.
5.0.2 S&P Sector Bullish Percent Index, so many sectors are overbought and even have several years new high.
Now some charts from www.sentimentrader.com. They have all reached certain extremes since the year 2007 bear market which were very useful for calling a top. But if this is going to be a bull market, from longer history, they might mean nothing, so just watch them for fun.
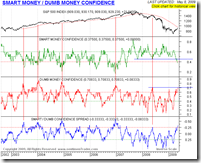
Smart Money/Dumb Money Confidence, worked very well in 2008.
But here’s a longer history chart.
InsiderScore.com Buy/Sell ratio, insiders are selling into the rally, well, again, says nothing from a longer history point of view.
AMG Data Equity Mutual Fund Flow, I read a report saying the Mutual Fund Money on the sideline will chase high here because of the anxiety of being underperform so there’ll be no pullback from now on. Here’s a chart about the Equity Mutual Fund Flow which has already reached a bear market high. Yeah, again, it means nothing for a bull market.
AAII Bull Ratio, retailer investors are bullish, not in extreme though.


14 Comments