Summary:
The market could be at a cycle bottom so probably more upside ahead.
| TREND | MOMENTUM | EMOTION | COMMENT - Sample for using the trend table. | |
| Long-term | Up | Disbelieve | ||
| Intermediate | Down | Neutral | ||
| Short-term | Down | Neutral | ||
| SPY SETUP | ENTRY DATE | INSTRUCTION | STOP LOSS | Mechanic trading signals for reference only. Back tested since 2002. |
| ST Model | 11/30 L |
*Long intraday. |
1.5xATR(10) |
Use 2% as the stop loss for SPY. No confidence in this trade.
|
| Reversal Bar | 11/30 L |
*Long intraday. |
0.9xATR(10) |
Use 2% as the stop loss for SPY. No confidence in this trade.
|
| NYMO Sell | 11/24 S | Breakeven |
|
|
| VIX ENV | ||||
| Patterns ect. |
INTERMEDIATE-TERM: BUILDING A TOP
Maintain the “building a top” forecast. For details please see 11/27/2009 Market Recap.
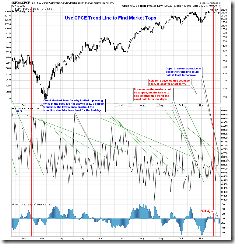
2.8.0 SPX:CPCE, trend line broken, the market could be topped as long as the trend line holds tomorrow. Just this chart didn’t work well for predicting an intermediate-term top recently, OK for short-term top though.
SHORT-TERM: COULD BE MORE REBOUND AHEAD
No solid evidences, just bulls have more charts backing them up, so could be more rebound ahead.
Two reversal bars in a row formed on lots of indices’ daily chart, so the chances are good that the market has reached a short-term bottom. 1.3.0 Russell 2000 iShares (IWM Daily), the reversal bars are more clear on this chart, besides the volume looks promising too.
0.0.3 SPX Intermediate-term Trading Signals, today’s low could be seen as a 10 day cycle low, so there’s a good chance that the next 10 trading day could be an up cycle.
1.0.9 SPX Cycle Watch (60 min), looks like a cycle low too.
INTERESTING CHARTS:
I saw lots of people mentioning this, so thought you might want to know: Full moon was the bottom recently (chart below is from www.astrocycle.net). And 12/2 will be the next full moon. Personally, I think full moon or new moon simply means a potential trend change, so if the market rebounds to 12/2, then probably 12/2 is a top.
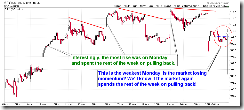
This chart is “bear” friendly, if it repeats what happened in the last 3 weeks: up huge on Monday then pullback the rest of the week. We'll see.


