THE BOTTOM LINE, THE SHORT-TERM TREND IS UP, I HOLD LONG POSITION OVERNIGHT.
I’m bearish biased toward tomorrow which as usual, I’ll present my witnesses in tonight’s report. If you want to be a very short-term bear, shorting right now in AH may not be a good idea because statistically at least there’ll be a price that is higher than today’s close some time tomorrow which means you should be able to get a better entry if you short tomorrow. Just beware, trading against the trend is always dangerous no matter how statistics says.
I see one very short-term short setup today: SPY up 3 days in a row but volume down 2 days in a row (so called price volume negative divergence), short at today’s close, surprisingly the winning rate WAS not bad, although I really hate this setup.
Cobra Impulse System is now officially in buy mode. The long setup HAD 80% winning rate. So hopefully it could be right this time.
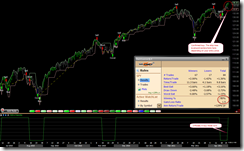
There’s one warning I’d like you to know about the Cobra Impulse System’s long position though: If you still remember the SPY ST Model, which has a very good way of detecting a market top but unfortunately I haven’t got the time to test whether the top detecting algorithm could be used in Cobra Impulse System yet. For now I just want you to know that SPY ST Model is yelling for a top of some kind and therefore asking for tightening the stop loss. The 2nd chart below shows clearly how the top detecting algorithm worked in the past which was pretty amazing. I’ll integrate this top detecting algorithm into the Cobra Impulse System, if it turns out to be correct again this time.
MECHANICAL TRADING SIGNALS:
| TREND | MOMENTUM | COMMENT | |
| Long-term | 2 of 2 BUY | ||
| Intermediate | 4 of 5 BUY | 5 of 5 NEUTRAL | Cobra Impulse in *BUY mode; Non-Stop in BUY mode. |
| Short-term | 5 of 6 NEUTRAL | ||
| SPY SYSTEM | ENTRY | STOP LOSS | INSTRUCTION: back test is HERE, signals are HERE. |
| Non-Stop | *04/28 L | N/A | *Long position initiated on 04/28. |
| CI Buy & Hold | *04/28 L | N/A | *Long position initiated on 04/28. |
| CI Swing | *04/28 L | *1.7*ATR(10) | *Long position initiated on 04/28. |
DEMO ACCOUNT FOR SHORT-TERM MODEL:
|
|||||||||||||||||||||||||||||||||||||||||||||||||||||||||||||||||||||||||||||||||||||||||||||||||||||||||||||||||||||||||||||||||||||||||||||||||||||||||||||||||||||||||||
|


