Summary:
Could be a turning point whenever ISEE Indices and ETFs Only Index is over 200.
Intraday chart pattern argues for a potential upside breakout.
Several charts argue that it might not be the time to take aggressive long positions.
| Trend | Momentum | Comments - Sample for using the trend table. | |
| Long-term | Up | ||
| Intermediate | Up | Neutral | |
| Short-term | Down* | Neutral | |
| My Emotion | No idea | Neither believe this bull nor want to be a hero to short against it. |
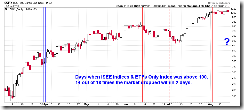
As mentioned in the Friday’s After Bell Quick Summary, I wasn’t sure if the ISEE index final reading was correct or not. And now, I’m still not sure, just I cannot wait anymore. The following 2 charts are my simple research about whenever ISEE Indices and ETFs Only Index over 100 and over 200. For the cases over 100, I’ve been mentioning for quite several times in the past, it usually means a down day within 2 days. There’re not lots of cases over 200, so difficult to draw a conclusion. Just since 2006, it seems that over 200 usually means very close to a turning point, which logically seems convincing because a sudden CALL volume surge should mean that big money sees something ahead which we retailers don't know yet. Besides, I know several cycles are arguing for a potential turning point next week, combining with the Friday’s unusual ISEE readings, it doesn’t look like a coincidence, does it? Well, let’s wait and see.
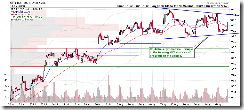
I expect a green Monday. From 1.0.3 S&P 500 SPDRs (SPY 30 min) and 1.1.5 PowerShares QQQ Trust (QQQQ 30 min), I see Symmetrical Triangle and Ascending Triangle, they both have upside breakout potentials.
Several other charts needs keep eyes on. Overall, my feelings are that it might not be the right time to take aggressive long positions.
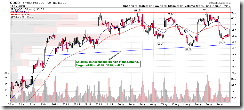
3.1.0 PowerShares DB US Dollar Index Bullish Fund (UUP Daily), as expected, US$ rebounded. There’s a proprietary indicator (copyright protected, I cannot show here), by the way, arguing that US$ might have bottomed which is not good for the stock market.
5.0.5 S&P Sector Bullish Percent Index I (Weekly), 5.0.6 S&P Sector Bullish Percent Index II (Weekly), quite a few most bullish ever readings. For your conveniences I’ve put all the overbought readings on the same chart. This chart is the main reason why I said it might not be the right time to take aggressive long positions.
7.3.6 Weekly STO Trading Signals, weekly signal worked pretty well since the end of 2007. It argues for SELL now.
7.3.7 NYSI Trading Signals, seems like since 2007, whenever NASI signaled before NYSI, NYSI would follow. Now NASI signaled SELL (need further confirmation though), will NYSI follow again this time?
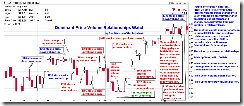
7.7.9 Russell 3000 Dominant Price-Volume Relationships, price down volume up last Friday. It looks to me that the recent price-volume relationships were all bearish.


19 Comments