Summary:
INDU still lags, but may catch up later.
Expect at least a short-term pullback.
| Trend | Momentum | Comments - Sample for using the trend table. | |
| Long-term | Up | ||
| Intermediate | Up | Neutral | |
| Short-term | Up | Neutral | |
| My Emotion | Wait | Could repeat what happened after 8/17, so be careful bears. |
INTERMEDIATE-TERM NO UPDATE
1. SPX has no serious resistances until 1200ish but chart 0.0.3 SPX Intermediate-term Trading Signals has too much negative divergence, so bulls still should be careful.
2. 1.2.0 INDU Leads Market, INDU still failed to confirm the SPX new high; 1.2.1 Dow Theory: Averages Must Confirm, TRAN too has yet confirmed the INDU’s new high. Personally, I won’t weight these too much because they may catch up later.
SHORT-TERM EXPECT A PULLBACK
7.1.1 NYSE Percent of Stocks Above MA200, very close to the 2004 high. Pay attention to the dashed vertical line, SPX (green curve) at that time became flat and pulled back eventually. Moreover, a very special chart I’d like your attention today, is T2111 from Telechart - NYSE percent of stocks 2 standard deviation above MA200, which reached an all time high today. I don’t think this could last long.
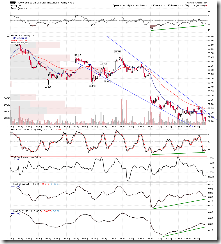
1.0.3 S&P 500 SPDRs (SPY 30 min), too much too large negative divergence, plus CPCE <= 0.56 mentioned in the After Bell Quick Summary, so still possible a short-term pullback is due.
7.3.2 SPX Cycle Watch (60 min), a cycle is due today which means that SPX could turn down within days.
T2103 Zweig Breadth Thrust from Telechart, overbought, the reading now is very close to an all time high.
3.1.2 PowerShares DB US Dollar Index Bullish Fund (UUP 30 min), lots of positive divergence, so still US$ could rebound which is not good for the stock market.
Oh, one more thing, I noticed: Bears are very quiet today… 🙂


