Today the main problem is the volume has dried up. Indices have been going up for four days but the volume keeps shrinking, which is a highly bearish pattern and likely causes a reversal. In addition, 5.2.0 Energy Select Sector SPDR (XLE Daily) and 5.6.0 Materials Select Sector SPDR (XLB Daily) rallied significantly while 5.3.0 Financials Select Sector SPDR (XLF Daily) did not although some decent ER released in the morning, and this usually means the rally will not last long. Furthermore, on 1.3.7 Russell 3000 Dominant Price-Volume Relationships the dominant price-volume relationships are 1066 stocks were price up volume down, which is again very bearish.
Therefore, the market is due for pullback tomorrow.
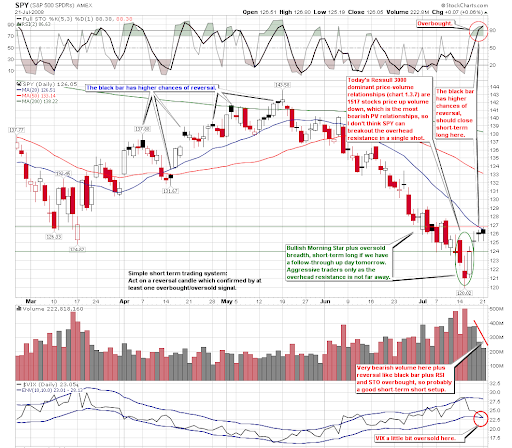
0.0.1 Simple SPY Trading System. Note the bearish volume pattern, the black candle which has a high chance of reversal, and the overbought of RSI and STO indicators, as well as the oversold VIX/MA(10) at the bottom of the chart, all these signals are saying short-term short.
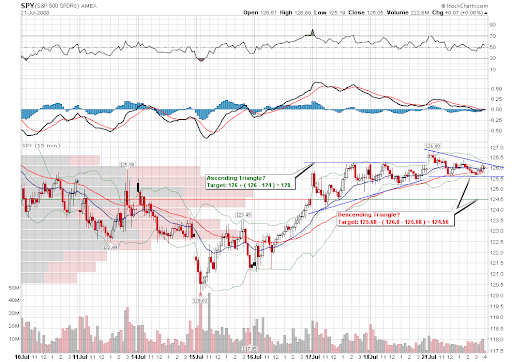
1.0.7 S&P 500 SPDRs (SPY 15 min). On the 15-min intraday chart, the Descending Triangle is targeting 124.56. By the way, the Ascending Triangle pattern mentioned yesterday indeed broke out upward but didn't reach the projected target. In fact the pattern on the intraday charts are quite reliable. Compared with technical indicators, chart patterns are more accurate in my opinion.
1.2.7 Diamonds (DIA 15 min). The Descending Triangle is targeting 112.93.
1.3.0 Russell 2000 iShares (IWM Daily). Overbought after four days of rally, volume is decreasing, very bearish. On 1.3.6 Russell 2000 iShares (IWM 15 min), the bearish Rising Wedge indicates a possible pullback.
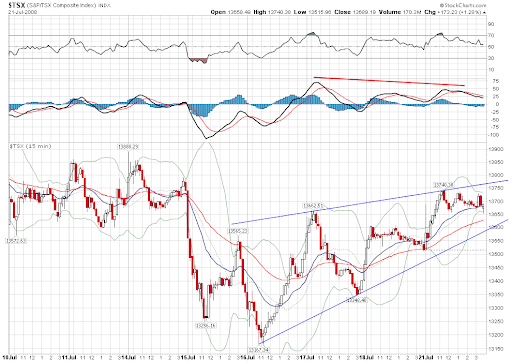
1.4.0 S&P/TSX Composite Index (Daily), bearish Rising Wedge. 1.4.2 S&P/TSX Composite Index (60 min), 1.4.3 S&P/TSX Composite Index (15 min), on both the 60-min and 15-min chart, the bearish Rising Wedge patterns are clear. In addition, MACD on the 15-min chart shows negative divergence. So the Canada market is due for pullback, too.
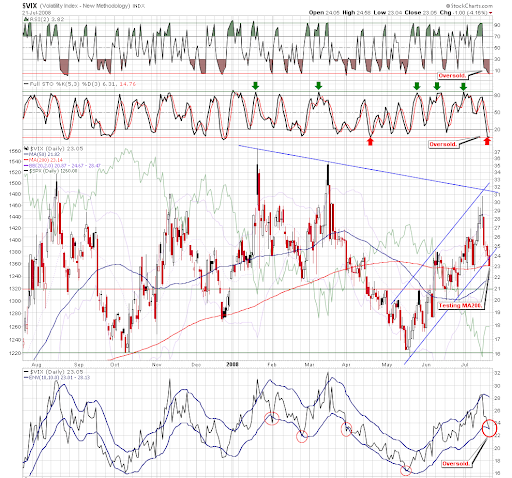
2.0.0 Volatility Index - NYSE (Daily). VIX is extremely oversold. It is now testing MA(200), also note the MA(10) envelope, which has entered into the region of mid-term oversold. Take further notice at the locations where VIX broke MA(10) envelope (marked by red circles), the latest oversold condition is quite significant. Therefore, if VIX drops further tomorrow, no matter the market goes up or down, it is an excellent chance to initiate short positions. Regardless how bullish the market is in the near term, remember that the primary trend is down. Short positions based on such a good signal has a high probability of success.
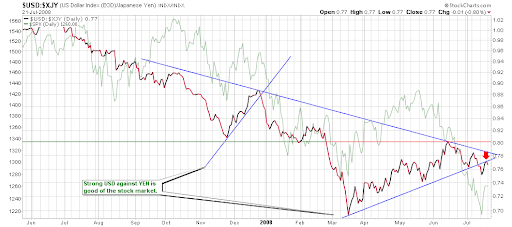
3.2.0 Japanese Yen (Daily). It is supported by MA(200). The rally of Yen means the plunge of the stock market because of unwind carry trade. 3.2.3 US Dollar/Japanese Yen Ratio, note that the ratio has bounced back by the resistance, and this is very bearish to the stock market.
3.3.0 streetTRACKS Gold Trust Shares (GLD Daily). The gold bounced up from the support. It is a good entry-point.
3.4.3 United States Oil Fund, LP (USO 60 min). Here is the only good news for bulls -- the oil is getting a resistance at the moment.
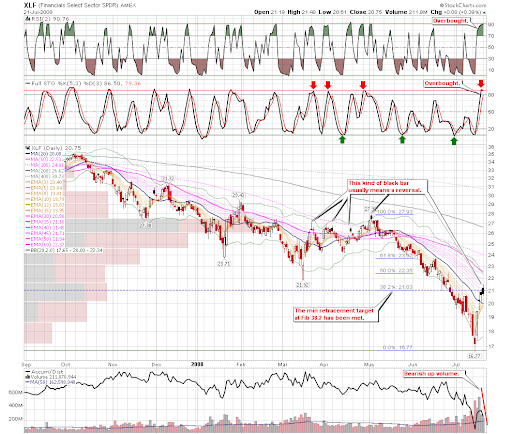
5.3.0 Financials Select Sector SPDR (XLF Daily). Overbought, and black candle, plus bearish up volume. Very bearish.