Okay, the market finally pulled back, and those overbought signals what I was buzzing for two days have also gone neutral. So what will the market do tomorrow, no idea. However, three major indices all showed Evening Star which is bearish, and this candle is so accurate that the confirmation tomorrow is nearly unnecessary. Furthermore, the US dollars may also pullback. As a consequence of all these factors, the pullback is likely continued.
0.0.1 Simple SPY Trading System. As I said yesterday, Bearish Shooting Star and if the market pulled back today this candle got confirmed. Therefore you should have take the short-term short.
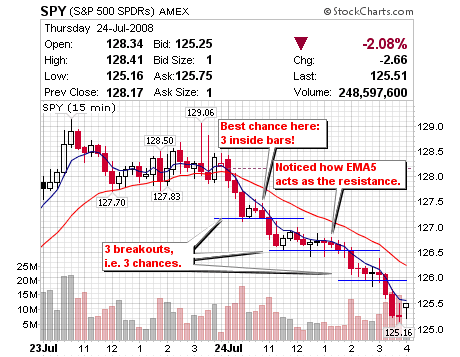
On the 15-min intraday chart, there were three nearly perfect chances for day trading (DT). The breakout of Open Range at about 11AM was the best setup today, because there were three inside bar prior to the breakout which has a high probability of success among DT Base and Breakout Setups. An inside bar likes a string which accumulates energy, once it breaks out it is going to be violent, and this is why trading the inside bar breakout is likely more successful.
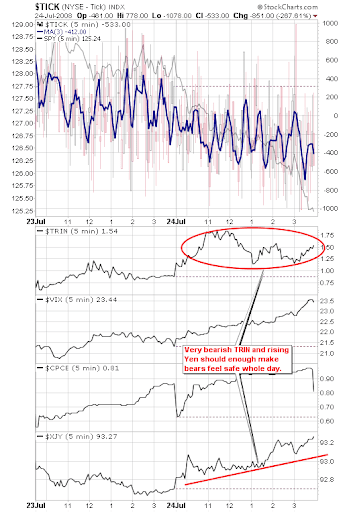
Afterward there were two times of consolidation. However bears should feel pretty safe because TRIN on 2.1.2 NYSE - Tick (5 min) stayed above 1.2 all the time, and more importantly $XJY was rising the whole day. So you have no reason to fear the trend reversal.
When the market was about to close, you might lock profit, or keep your positions because the Evening Star on the daily chart has a higher chance of further down. The downside target is at Fib 50, about 124.48.
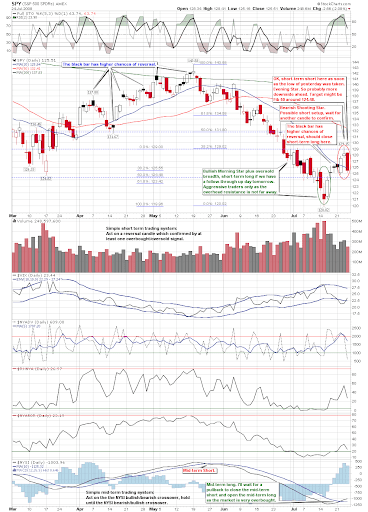
On the other hand, swing traders don't need to concern the open range breakout. Once the yesterday low was broken, they should feel safe to short.
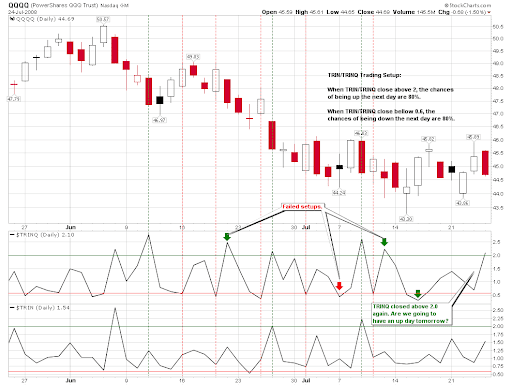
1.1.0 Nasdaq Composite (Daily). It's an Evening Star. The target is likely Fib 50 at 2250. But on 0.0.8 TRINQ Trading Setup TRINQ is over 2.0 today, which means QQQQ may go up tomorrow. I don't know which one is more likely. Possibly tomorrow is a small rally since Evening Star doesn't mean the next day will be down for sure, it can mean the trend in the next few days is downward.
1.2.0 Dow Jones Industrial Average (Daily). Evening Star. The possible target is Fib 50 at 11261.
1.4.0 S&P/TSX Composite Index (Daily). The Canada market has plunged for three days and the volume was increasing, which look a bit like capitulation. So I think it may bounce back.
1.5.0 Shanghai Stock Exchange Composite Index (Daily). It looks bullish, and possibly a Head and Shoulders Bottom. Of course, the pattern isn't valid before the neckline is broken.
1.6.0 Hong Kong Hang Seng (Daily). Note the resistance on STO and RSI(14) indicators.
3.0.0 10Y T-Bill Yield. It is a Bearish Abandon Baby and will possibly go down for a while. This is very important because its downside movement means the money flows to the bond market, so it is bearish to the stock market. Its down also indicates the demand for the US treasury bill is weak which will cause the depreciate of US dollars, which will in turn cause the appreciation of Japanese Yen. As a result the Carry Trade unwinds, and this is bearish to the stock market.

3.1.0 US Dollar Index (Daily). It's a Spinning Top, so the trend may reverse. In addition note the resistance on the STO, so it may go down.
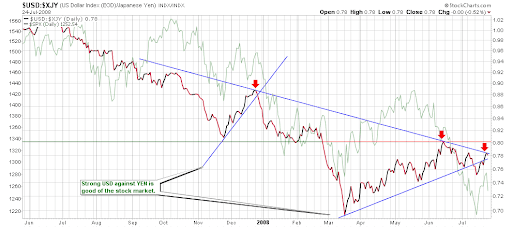
3.2.3 US Dollar/Japanese Yen Ratio. If the USD goes down, watch this chart. If it cannot pass the resistance, the Carry Trade will unwind and the market may go down as well.