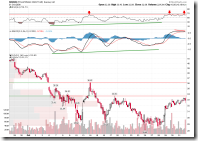
0.0.3 SPX Intermediate-term Trading Signals. All mid-term signals are there, which means the next game is to buy dip.
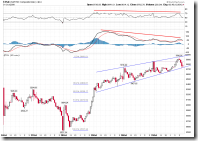
0.0.2 SPY Short-term Trading Signals. In the short term, there are many overbought signals, so theoretically the market is due for a pullback. If it doesn't pull back (intraday pullback counts), do not chase high. You may check out what happened previously in the similar setup marked in blue circle.
1.0.3 S&P 500 SPDRs (SPY 60 min), 1.1.5 PowerShares QQQ Trust (QQQQ 60 min), 1.2.3 Diamonds (DIA 60 min). Note that the resistance on RSI always hold, which is not good.
1.0.4 S&P 500 SPDRs (SPY 15 min), 1.1.6 PowerShares QQQ Trust (QQQQ 15 min), 1.2.4 Diamonds (DIA 15 min), Bearish Rising Wedge, MACD and RSI show negative divergence. So the market might pull back on Monday.
1.1.0 Nasdaq Composite (Daily). The volume decreased for four days during the rally of four days. This is a typical of price-volume divergence, so the market is due for a pullback.
2.4.5 NYSE - Tick. This chart is recommended by a reader of my blog. Note the blue curve at the current level predicts a high possibility of pullback.
3.2.0 CurrencyShares Japanese Yen Trust (FXY Daily). It seems Yen gets a support by 20-day moving average, so it may bounce back which means the stock market is due for a pullback.
1.4.3 S&P/TSX Composite Index (15 min). Bearish rising wedge on the Canadian market, MACD and RSI show negative divergence as well. So it may pull back.
1.4.4 TSE McClellan Oscillator. It is overbought.


3 Comments