Today a reader wrote to me and asked why my mid-term outlook was bullish in the past two weeks albeit the market kept selling off. He mentioned that there were many mid-term sell signals, especially MACD had been sell since Sep 4th.
Firstly I would like to clarify that, mid-term and short-term are different, a bullish mid-term outlook has nothing to do with the short-term trend whether the market goes up or down.
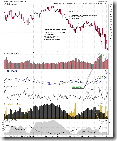
Indeed, The government intervention on Sep 19th did bring some trouble to my trading. On the other hand, the chart 0.0.1 did indicate a bottom (refer to the following chart which still contains false judgement), and 1.0.6 had been confirmed buy signal. Therefore, from the perspective of the technical analysis, it was right to net long from Sep 19th to Sep 26th by following TA trading signals.
On Monday the market broke out downward, and this indicates that the previous bottom is a false signal. Consequently, I did not recommend to catch the bottom from that time. In my reports, I kept saying that I was not sure if there would be a lower low, bottom-fishing is ahead of signal, be cautious to long, etc. Note that what I mentioned was referring to short-term.
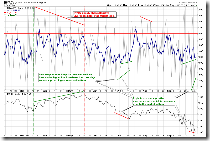
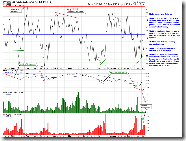
Why was the mid-term outlook bullish? As I explained, the most important is 0.0.3 VIX:VXV, which indicated that 90-day projected volatility should be lower than the current value, which in turn meant that the market after 90 days might be higher than current close. In addition, 2.4.3 was extremely oversold, 2.4.2 and 2.4.4 showed typical bottoming pattern, positive divergence. Under such situation, the risk of net short was relatively high, and the best strategy should be holding cash if not day trading. In fact, this was what many professional traders were doing.
Concerning why my mid-term outlook was bullish without clear mid-term buy signals, as I mentioned in my report, the safe strategy is to wait for the mid-term buy signal, which is the mid-term trading signal instead of forecast. Forecast is conceptually different from trading. On the other hand, sometimes the mid-term signals can be whipsaw. For instance, 1.0.6 occasionally flipped to buy after Sep 16th. Previously I also explained that it is not guaranteed to be profitable by blindly following mid-term signal. By the way, many back tests show that simply following MACD is not profitable either.
My analysis is based on the market breadth, not technical indicators. The reason is as aforementioned, the back test shows that indicators are not accurate, but accuracy of breadth signals are much higher. Nevertheless, the timing of breadth could be more or less off, and this is exactly why the market has not rallied after two weeks. Anyway, there are many evidences on my daily report and these evidence should not be overlooked just because MACD is still a sell signal. Let me emphasis again, my back test shows that MACD itself doesn't work reliably, neither RSI, neither STO, nor any other simple technical indicators.
The point is that I must show the evidences that I see on the charts from time to time, and make a conclusion from these evidences. I cannot say that -- well, the mid-term signal is still sell, so these oversold signals as well as divergence are pointless, let's forget them. However I have no control to if or not these signals are valid or when they will be approved by the market. There is no 100% accurate signal, and my emphasis is on the probability over the long term. To achieve a steady long term probability, it is important to eliminate the thinking of maybe probably perhaps... this time is different.


6 Comments