| Trend | Momentum | Comments - Sample for using the trend table. Warning: This is NOT a trading recommendation! | |
| Long-term | Down | Idea for trading intermediate-term under primary down trend. | |
| Intermediate | Up | Overbought | According to $NYA50R and $CPCE, the market might be topped. |
| Short-term | Up | Neutral |
| Report Focused On | Buyable dip or the market topped? |
| Today’s Summary | Expect market seesaw for a few weeks. Expect a pullback as early as the next Monday. |
7.1.0 Use n vs n Rule to Identify a Trend Change. Bulls have pushed up the market for 4 days but still cannot recover the loss that bears made in a single day. Nevertheless the upward momentum is weakening, according to 8.0.3 Use n vs n Rule to Identify a Trend Change 2008 the market will seesaw and the game is buy dip and sell bounce. However, bears will win more N vs N, which means it’s probably safer to sell bounce. Keep an eye on INDU, according to 1.2.0 INDU Leads Market, if SPX breaks out 875 in the next week while INDU fails to make a higher high, that will be the third market topped signal after $NYA50R and $CPCE.
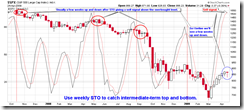
7.0.6 Weekly STO and the Market Top/Bottom. Here is another evidence for seesaw – market will at least up and down for several weeks once weekly STO gives a sell signal at overbought level.
In the short term, I think the market will pullback on Monday, or as late as Tuesday.
T2103 from Telechart, Zweig Breadth Thrust is the primary reason why the market should pullback on Monday. The overbought on T2103 seems very accurate so far.
Intraday Cumulative TICK from www.sentimentrader.com, the overbought of this indicator is also quite accurate, while we cannot rule out the possibility of further rally on Monday. However, even the market does go up the upside movement will be limited according to the past patterns.
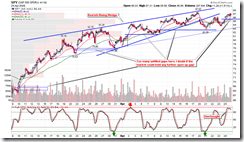
1.0.2 S&P 500 SPDRs (SPY 60 min). Too many unfilled gaps, should the market gap up again on Monday, it could be an opportunity for short sell.
1.0.4 S&P 500 SPDRs (SPY 15 min), Bearish Rising Wedge plus lots of negative divergence.
In the intermediate term, the market is still overbought, and the negative divergence on the breadth signals are very obvious, this means a pullback is needed.
0.0.3 SPX Intermediate-term Trading Signals, 1.1.4 Nasdaq 100 Index Intermediate-term Trading Signals, overbought plus negative divergence.
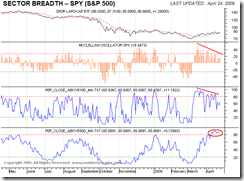
SPY breadth from www.sentimentrader.com, again overbought plus negative divergence, it looks very bearish.
Lastly let’s take a look at 2.0.1 Volatility Index (Weekly), STO is turning up.


9 Comments