Summary:
Expect at least a short-term pullback.
| Trend | Momentum | Comments - Sample for using the trend table. | |
| Long-term | Down | Idea for trading intermediate-term under primary down trend. | |
| Intermediate | Up | Neutral | |
| Short-term | Up | Neutral |
For 5 days the market has stuck in a range. Although, officially the breakout direction is unknown but since the intraday breakout today failed to hold, which feels like a head-fake to me, therefore now I’m inclined to think that the real breakout direction will be on the downside.
0.0.2 SPY Short-term Trading Signals, 5 consecutive reversal like bars. In normal cases, 1 to 2 reversal bars are enough to lead a trend reversal. Now we have 5, if the “highly praised” candlestick pattern analysis is of a little little use, SPY should pullback soon.
2.0.0 Volatility Index (Daily), 2 “open low close high” reversal bars, VIX may rise from here which is not good for the stock market.
1.0.2 S&P 500 SPDRs (SPY 60 min), lots of negative divergences.
2.8.0 SPX:CPCE, whenever CPCE < 0.56, the next day was not very pleasant.
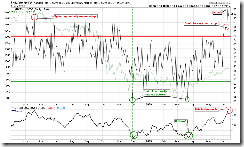
2.3.4 Nasdaq Total Volume/NYSE Total Volume, the normalized ratio at bottom is way too high. This chart may look strange but in reality, it’s a very reliable indicator which I don’t think should be neglected.
7.7.9 Russell 3000 Dominant Price-Volume Relationships, for 2 days in a row, we have bearish price volume relationships. I don’t think they should be neglected as well.


13 Comments