Summary:
Could be a short-term rebound at least Monday morning.
Could be a weak short-term rebound because of the flight to risk on Friday's sell off.
VIX has potential of rising more which paints a gloomy intermediate-term.
| Trend | Momentum | Comments - Sample for using the trend table. | |
| Long-term | Down | Idea for trading intermediate-term under primary down trend. | |
| Intermediate | Down | Neutral | |
| Short-term | Down* | Neutral |
Since short-term model from www.sentimentrader.com is oversold, so we might see a rebound at least Monday morning.
But, I see a flight to risk on Friday's sell off:
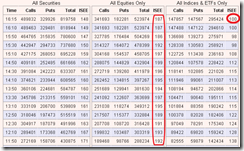
1. ISEE “All Equities Only” rose even to 199 on Friday which means that retailers were almost 2 times more bullish than being bearish. The “All Indices & ETFs Only" was closed at 100 which I’ve discussed here before, as since the March rally, every time we had readings greater than 100, short-term bulls were not very pleasant.
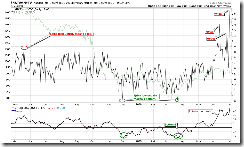
2. 2.3.4 Nasdaq Total Volume/NYSE Total Volume, speechless. For the longer history view, please refer here: 8.0.1 Use NATV/NYTV to catch the market top/bottom. Also, don’t forget that the Tech Bullish Percent Index is still overbought, so even we treat this unusual high NATV:NYTV ratio as a positive sign there might not be much upside room left.
So based on the above info, I tend to believe the short-term rebound if any, won’t be strong. While on the other hand, there’re good chances that we’ll see another Major Distribution Day. 7.1.3 Major Accumulation/Distribution Days, Friday was a Major Distribution Day. Because a good rebound had already occurred after the previous 2 Major Distribution Days, so now the Friday’s Major Distribution Day should be counted as the first Major Distribution Day which means there’ll be a 2nd Major Distribution Day.
Intermediate-term looks gloomy to me as VIX has very good chances to rise further.
2.0.1 Volatility Index (Weekly), long-term support plus possible Bullish Falling Wedge plus STO positive divergence, VIX should have pretty decent chance to rise from here.
From Seasonality, here’s a good post: VIX at Seasonal Cycle Low.
7.3.3 VIX:VXV Trading Signals, this chart also says that VIX will rise since VXV could be seen as what VIX looks like in 3 months.
OK, lastly, let me conclude this report with a quote from John Murphy:
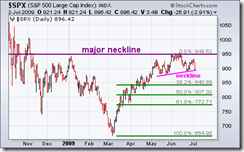
A PATTERN WITHIN A PATTERN... Earlier in the spring, I wrote about the possibility of a major "head and shoulders" bottom forming in the S&P 500. I drew a potential "neckline" over the January high which appears to have stopped the spring rally. That sets the stage for the formation of a possible "right shoulder" as part of a bottoming process. I wrote last weekend that a retracement of 38% to 50% of the spring rally was a likely downside target for that correction. The green Fibonacci retracement lines in Chart 2 shows those potential support levels. (The 62% retracement line is just above the level of the "left shoulder" formed in November and can't be ruled out either). The smaller (pink) neckline drawn under the May/June lows highlights the smaller head and shoulders top that I've identified recently. A close below that smaller neckline (which appears likely) would turn the short-term trend lower. [The actual downside target from that smaller top measures to 820]. Since the spring rally lasted three months, a downside correction shouldn't exceed that amount. That puts the outer limit for another bottom sometime in September (which fits with a usual seasonal autumn bottom). So while the short-term picture has worsened, the longer-term view remains more positive. I suggested a couple of weeks ago that "short-term" traders take some profits. Longer-range investors should view a downside correction over the summer months as an opportunity to do some buying at lower levels.


6 Comments