Nothing to imply, just show you something interesting to remind you, hey, don’t forget this blog!
Here’s the comment I see everyday from www.stocktiming.com:
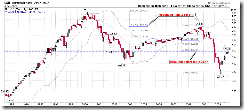
Chart 1-1: The Institutional Index of "core holdings"...
Overview: This is one of the first charts we look at everyday because Institutions represent over half of the market's volume and they have a predominant influence on the market. As an index, Institutional movements track better technically than any of the other indexes. For instance, on October 11th. 2007, the Institutional "core holdings" index hit an EXACT 61.8% Fibonacci retracement while the other indexes did not. That day marked the EXACT top of the market.
Well, here is the monthly Institutional Index chart. If the last rally stopped right at Fib 61.8 then could Fib 38.2 possibly mean the rally is over?
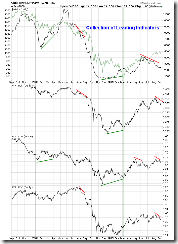
A collection of leading indicators listed below, any additional add-on to recommend?
By the way, could anyone recommend me a very good back test software or services? (Like for the past 100 cases, there were 36 cases a green close next day) Thanks.


