TREND INDICATOR MOMENTUM INDICATOR COMMENT (Click link to see chart) Long-term 3 of 3 are BUY Intermediate 3 of 3 are SELL 5 of 6 are NEUTRAL SPY ST Model is in SELL mode Short-term 1 of 1 are SELL 9 of 9 are NEUTRAL
BULLISH 6.3.2c Major Distribution Day Watch: Bottom is close?
0.0.9 Extreme Put Call Ratio Watch: *Bottom is close?
2.0.0 Volatility Index (Daily): *3 reversal bars in a row, VIX may pullback.BEARISH 6.3.0 Major Accumulation/Distribution Days: Another Major Distribution Day ahead? CONCLUSION
SPY SETUP ENTRY DATE STOP LOSS INSTRUCTION: Mechanic signals, back test is HERE, signals are HERE.
TRADING VEHICLE: SSO/SDS, UPRO/SPXUST Model 02/04 S 1.9 x ATR(10) Reversal Bar 02/04 S *Stopped out short position flat. NYMO Sell VIX MA ENV
OTHER ETFs TREND COMMENT – *New update. Click BLUE to see chart if link is not provided. QQQQ IWM CHINA Down Double Top or Bearish 1-2-3 Formation? EMERGING Down CANADA Double Top, target $15.77. FINANCIALS Down Could be a confirmed Head and Shoulders Top. REITS Measured Move, target $41.54. *Stick Sandwich pattern confirmed. MATERIALS ENERGY Down Confirmed Double Top. OIL Could be a Double Top in the forming. GOLD Down Descending Triangle, target $91.08. DOLLAR UP Head and Shoulders Bottom, target $24.28. BOND 3.0.0 10Y T-Bill Yield: Bearish 1-2-3 formation, target 34.43.
INTERMEDIATE-TERM: INITIAL PULLBACK TARGET MET BUT COULD BE MORE
No update, see 02/05/2010 Market Recap, Fib 38.2% retracement target was met, but I suspect there’s more. There’s a chance that after the pullback is over, we’ll see a new high followed by a bigger pullback thereafter.
SHORT-TERM: MARKET MAY VERY CLOSE TO AT LEAST A SHORT-TERM BOTTOM
See table above, two additional bullish signals were added, therefore chances are increasing significantly that the market may very close to at least a short-term bottom. But still there’re 2 concerns. Firstly, 6.3.0 Major Accumulation/Distribution Days, the Major Distribution Day seldom comes alone, in another word is that there could be another big sell off ahead. Secondly, 6.4.A SPY Bottom Shape, see chart below, comparing to the past bottom shape, do you think the current shape look like a bottom? So the conclusion is, a bottom (could be either short-term or intermediate-term) should be very close but the market may test 02/05 low first. Of course, the market could keep rising from here, if so, because the low is not tested, it’s not easy for the market to stand only on one foot, therefore it cannot go too far, eventually will have to come down at least to test the 02/05 low. If this is the case, then for sure, the 02/05 low is only a short-term bottom.
The three bullish signs mentioned above are listed below.
6.3.2c Major Distribution Day Watch, NYDNV:NYUPV > 35, usually a bottom is very close.
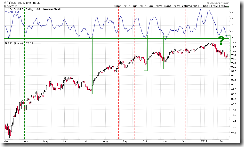
0.0.9 Extreme Put Call Ratio Watch, see green rectangles.
2.0.0 Volatility Index (Daily), three reversal bars in a row so VIX is very likely to pullback which means that SPX will rise.
STOCK SCREENER: For fun only, I may not actually trade the screeners. Since SPY ST Model is in SELL mode, only SHORT candidates are listed. For back test details as well as how to confirm the entry and set stop loss please read HERE. Please make sure you understand the basic risk management HERE.
Today’s screener has 0 stock found.
According to the entry rule, BRCM found yesterday wasn’t confirmed.


