|
||||||||||||||||||||||||
|
||||||||||||||||||||||||
|
*Please make sure you understand how to use the table above. The purpose of this report is to provide info so contradictory signals are always presented.
SHORT-TERM: TREND IS NOT CLEAR OFFICIALLY BUT I’M BEARISH BIASED
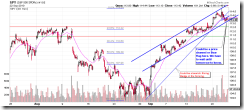
Short-term direction is not clear, either an up Price Channel or a Bear Flag is in the forming. So we’ll have to wait until tomorrow.
Since the chart pattern doesn’t confirm, so officially I cannot say top was in, but purely from signals point of view, I shall say either top was in or very close.
6.5.1a SPX and FOMC. As mentioned in today’s After Bell Quick Summary, a red day after a red FOMC meant more pullbacks ahead. Just it had only 3 cases recently, so may not mean anything. However, don’t forget the chart 6.3.1b Major Accumulation Day Watch as 2 red day after a Major Accumulation Day also meant more pullbacks. If a red day after a red FOMC means more pullback is merely a coincidence, then 2 red day after a Major Accumulation Day cases reflecting the same thing is just the 2nd coincidence? Two coincidences are just coincidence? Well, better take them a little bit seriously, I think.
VIX held below EMA(20) the 2nd day, if yesterday was merely a whipsaw, what the odds are whipsaw again today?
1.1.1 PowerShares QQQ Trust (QQQQ Daily), QQQQ hollow red bar doesn’t look good either.
INTERMEDIATE-TERM: STATISTICALLY BULLISH FOR THE NEXT 2 WEEKS
We could see 2 to 3 legs up while now is the very first leg up. See 09/17 Market Recap for more details.
SEASONALITY: WEEK AFTER SEPTEMBER TRIPLE WITCHING DOW DOWN 6 OF LAST 7
According to Stock Trader’s Almanac, week after September Triple Witching, Dow down 6 of last 7. Five in a row 2002 – 2006 with heavy losses 2002 – 2005. Also see September’s Triple Witching for more statistics.
HIGHLIGHTS OF THE OTHER ETFS IN MY PUBLIC CHART LIST
| TREND | COMMENT – *New update. Click BLUE to see chart if link is not provided. | |
| QQQQ | UP | 4.1.1 Nasdaq 100 Index (Weekly): NDX to SPX ratio too high. *1.1.1 PowerShares QQQ Trust (QQQQ Daily): Hollow red bar, pullback? |
| IWM | *DOWN | |
| CHINA | ||
| EMERGING | UP | 4.1.6 iShares MSCI Emerging Markets (EEM Weekly): EEM to SPX ratio too high. *1.4.1 iShares MSCI Emerging Markets (EEM Daily): Black bar under resistance, pullback? |
| EUROPEAN | UP | *2 black bars in a row, pullback? |
| CANADA | *DOWN | TOADV MA(10) too high plus lots of reversal like bars, pullback? |
| BOND | UP | |
| EURO | UP | |
| GOLD | UP | |
| GDX | UP | 4.3.1 Market Vectors Gold Miners (GDX Weekly): GDX to SPX ratio too high and Bearish Engulfing. |
| OIL | DOWN | |
| ENERGY | *DOWN | *2 reversal like bars rejected by MA(200), doesn’t look good. |
| FINANCIALS | *DOWN | 4.4.2 Financials Select Sector SPDR (XLF Weekly): Head and Shoulders Top in the forming? |
| REITS | *DOWN | 4.4.3 Real Estate iShares (IYR Weekly): Home builder is lagging and IYR to SPX ratio too high. |
| MATERIALS | UP |
*LA = Lateral Trend.


