SHORT-TERM: 10 OUT OF 12 CHANCES A DOWN DAY TOMORROW
Three cents:
- Could see red day tomorrow.
- There will be a rebound, so bulls have nothing to worry, FOR NOW.
- Trading wise, sharp down tomorrow, I’d be in bear’s camp, while rebound tomorrow, I’d stay with bulls.
Why could be a red day again tomorrow? See chart below, 10 out of 12 (83%) times a red day to follow-through a Bearish Reversal Day (that’s yesterday) means a red day the 3rd day (that’s tomorrow).
Basically, I still believe a RSI negative divergence is needed before a real pullback could kick in. The rally since 04/18 was just way too strong, it’s very rare for bulls to give up without fighting. The statistics below, from another angle, argues there will be a rebound: QQQ down 3 consecutive days, buy at close today, hold until the very first green day, you’ll have 79% chances since year 2003.
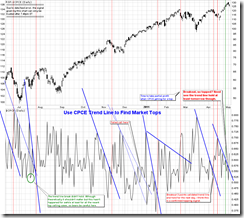
The broken of a 3 points validated CPCE trend line should mean a top of some kind as long as it could hold for tomorrow. If indeed the 10 out of 12 chances a red day tomorrow then the trend line most likely will hold. Besides, if a red tomorrow would be the SPY’s 3rd consecutive down days and since a strong uptrend should never ever have 3 consecutive down days, so chances would be very good that indeed we’re now around a top of some kind.
INTERMEDIATE-TERM: SPX NOW IN 1352 TO 1381 WAVE 5 PRICE TARGET AREA, WATCH FOR POTENTIAL REVERSAL
See 04/27 Market Outlook for more details.
SEASONALITY: BULLISH MONDAY AND FRIDAY
See 04/29 Market Outlook for more details. For May seasonality day by day also see 04/29 Market Outlook.
ACTIVE BULLISH OUTLOOKS:
- 09/27 Market Recap: 9 POMO within 20 trading days means 14%+ up in 3 months.
- 03/11 Market Recap: Bullish in 3 to 6 months.
- 04/21 Market Recap: QQQ weekly Bullish Engulfing is bullish for the next 6 weeks.
ACTIVE BEARISH OUTLOOKS:
- 04/21 Market Recap: SPX will close below 04/20 close soon.
HIGHLIGHTS OF THE OTHER ETFS IN MY PUBLIC CHART LIST:
|
||||||||||||||||||||||||||||||||||||||||||||||||||||||||||||
|


