SHORT-TERM: MAYBE TOPPED ON 05/02
Three cents:
- More pullbacks ahead.
- Still think Dollar at least should have a short-term rebound which also is one of the major reasons that I think more pullbacks ahead.
- Trading wise, I’ll sell the next bounce but with reduced positions, after all now officially the intermediate-term trend is till up.
Why more pullbacks ahead?
- SPX down 3 days in a row usually means a lower close (than that of today’s) ahead, at least.
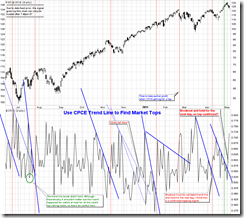
- CPCE 3 points validated trend line, broken yesterday and held for today, therefore confirms the top was in.
- A bad news todays is the OEX Open Interest Ratio surged again.
Why think Dollar at least should have a short-term rebound?
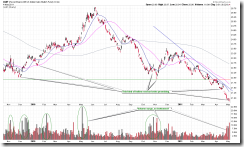
- UUP volume keeps surging plus the hollow red bar today looks promising.
- FXE is too high above the MA(200). Nothing on the planet Earth is beyond the law of gravity, so too far away from a moving average is perhaps the most reliable TA signals.
- The sentiment toward the Dollar is almost at the historical low.
INTERMEDIATE-TERM: SPX NOW IN 1352 TO 1381 WAVE 5 PRICE TARGET AREA, WATCH FOR POTENTIAL REVERSAL
See 04/27 Market Outlook for more details.
SEASONALITY: BULLISH MONDAY AND FRIDAY
See 04/29 Market Outlook for more details. For May seasonality day by day also see 04/29 Market Outlook.
ACTIVE BULLISH OUTLOOKS:
- 09/27 Market Recap: 9 POMO within 20 trading days means 14%+ up in 3 months.
- 03/11 Market Recap: Bullish in 3 to 6 months.
- 04/21 Market Recap: QQQ weekly Bullish Engulfing is bullish for the next 6 weeks.
ACTIVE BEARISH OUTLOOKS:
- 04/21 Market Recap: SPX will close below 04/20 close soon.
- 05/04 Market Outlook: At least a short-term top could have been in.
HIGHLIGHTS OF THE OTHER ETFS IN MY PUBLIC CHART LIST:
|
||||||||||||||||||||||||||||||||||||||||||||||||||||||||||||
|


