SHORT-TERM: MORE ON THE UPSIDE
I expect more on the upside, targeting SPX 1175ish (Fib 61.8% from 08/17 high to 08/19 low). However, I don’t expect huge up tomorrow, most likely it’ll be a small red or small green.
For the SPX target, 2 reasons supporting rebound to Fib 61.8%:
- Rectangle Bottom breakout, targeting Fib 61.8%.
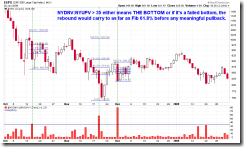
- NYDNV:NYUPV > 35, if indeed the low wasn’t in yet as I’ve been saying, then usually the rebound can go up to Fib 61.8% before any meaningful pullback. Listed below are all the rebound cases since year 2008.
Why don’t I expect huge up tomorrow, and it’s more likely small red or small green?
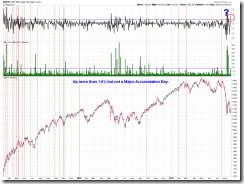
- SPX rose 3%+ today but it’s not a Major Accumulation Day, counting the red dashed lines below indicating a red next day, there’re 70% chances a red tomorrow.
- TICK > 1,000, very unlikely a huge up day tomorrow if not red.
- NYADV too high, 61% chances a red day tomorrow.
INTERMEDIATE-TERM: SPX DOWNSIDE TARGET IS 1,000, THE CORRECTION COULD LAST 1 TO 2 MONTHS
See 08/19 Market Outlook for more details.
SEASONALITY: NO UPDATE
Please see 07/29 Market Outlook for day to day August seasonality chart.
ACTIVE BULLISH OUTLOOKS:
08/18 Market Outlook: Relief rally could be within 3 trading days.
ACTIVE BEARISH OUTLOOKS:
- N/A
SUMMARY OF SIGNALS FOR MY PUBLIC CHART LIST:
|
|||||||||||||||||||||||||||||||||||||||||||||
|
|||||||||||||||||||||||||||||||||||||||||||||
|


