SHORT-TERM: LOWER CLOSE AHEAD
I see conflict between signal and price pattern today:
- Price pattern wise, it’s a breakdown from a 2 months long consolidation area, which usually means more on the downside, at least it’s the Fib 61.8% Measured Move to SPX 1079ish. Why is that? Because consolidation acts like a spring. Just image how powerful the spring would be after being squeezed for nearly 2 months? Besides, the consolidation area now becomes a formidable resistance that should not be easily broken via the very first rebound attempt.
- On the other hand, purely from the signal aspect, at least a sizeable rebound is due. Some signals, from my experiences, cannot be argued. And today we have two such signals, NYLOW and 3 Major Distribution Days, both are very reliable.
- Then how to resolve such a conflict? My experiences are that price pattern usually wins, let alone the target 1079ish is not far away (only one day’s distance as per nowadays dropping speed), plus there’s an additional evidence arguing for a lower close ahead, so my guess is we might go to 1079 first then possibly a huge rebound, instead of the low was in today.
The chart below needs a little experience to FEEL bad. Not experienced enough to feel why, then at least it should be clear how I get the target 1079.
The chart below is why I expect a lower close ahead. The exception is exceptionally rare.
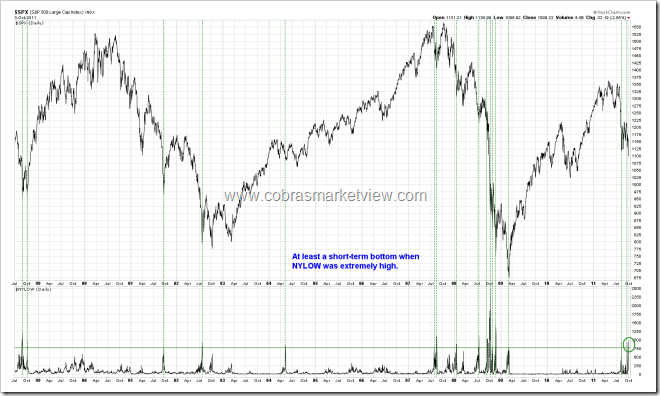
The charts below are those I said cannot be argued, a sizeable rebound is due.
Whenever NYLOW (NYSE New 52-Week Lows) closes to 1,000, at least a short-term bottom is close if not already in.
Generally there’d be a huge rebound after 2 to 3 Major Distribution Days. We have 3 Major Distribution Days now, very close to the limit (which was 4). This is perhaps the only indicator that still worked during the darkest period in year 2008.
INTERMEDIATE-TERM: SPX DOWNSIDE TARGET IS 1,000, THE CORRECTION COULD LAST 1 TO 2 MONTHS
See 08/19 Market Outlook and 09/30 Market Outlook for details.
SEASONALITY: BEARISH MONDAY, BULLISH OCTOBER AND 4TH QUARTER
See 09/30 Market Outlook for details. The outlook also includes the October day to day seasonality chart.
SUMMARY OF SIGNALS FOR MY PUBLIC CHART LIST:
|
||||||||||||||||||||||||||||||
|
||||||||||||||||||||||||||||||
|


