The market soared with a huge gain at the end of today, and many bulls are quite excited. However I am not convinced because of following two reasons:
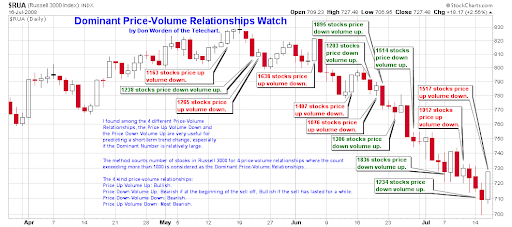
1). 1.3.7 Russell 3000 Dominant Price-Volume Relationships. Today 1517 stocks were price up volume down, which is considered the most bearish price-volume pattern. For tracking the relationship between up/down of price/volume and the market direction, a technical indicator is designed and so far it works quite well. This indicator, as shown in the following chart, says that as late as the day after tomorrow the market will drop. You may read those comments in red color and see if more than 1400 stocks were price up volume down, how big the probability of seeing a drop in the following trading days was.
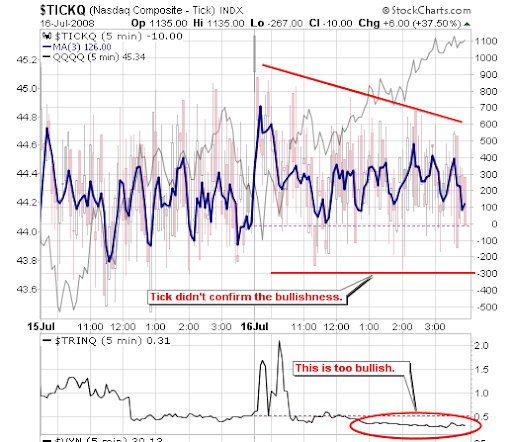
2). 0.0.8 TRINQ Trading Setup. It was over-bullish today because TRINQ was below than 0.3 during most trading hours. As you may know, if TRINQ closes below 0.6 then the next day may go down with the probability of 80%. Yesterday it was below 0.6, today the market disproved the prediction, how likely the setup is wrong again tomorrow? Furthermore, TICKQ has an obvious discrepancy with bullish TRINQ and this looks fishy, as you can see in the following chart.
Based on the aforementioned analysis, I am not convinced.
0.0.1 Simple SPY Trading System gives a short-term buy signal based on the bullish Morning Star candlestick pattern and two oversold breadth signals. However, based on previous explanation I doubt SPY will break above the resistance at 126 tomorrow, in other words, the profit is marginal. Therefore, this short term signal is for aggressive traders only. A better approach may be: wait at 126, if SPY cannot pass it over, kick it back. My prediction at the moment is, the market will have at least one more pullback, and once the drop-down reaches certain position it will likely be clear whether we have seen the bottom. I will show evidence to you later, please be patient for now.
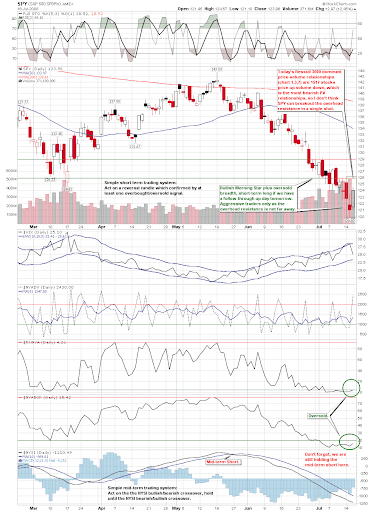
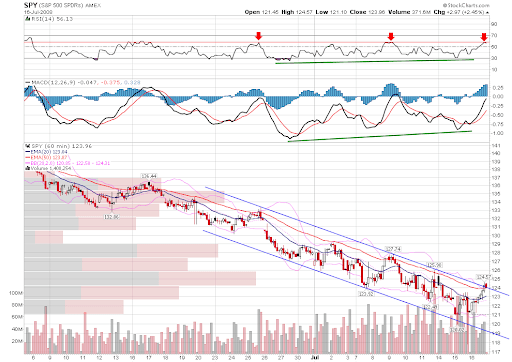
1.0.5 S&P 500 SPDRs (SPY 60 min), 1.1.8 PowerShares QQQ Trust (QQQQ 60 min), 1.2.3 Diamonds (DIA 60 min), 1.3.2 Russell 2000 iShares (IWM 60 min). RSI is facing with a resistance on these 60 min charts. Once RSI passes the resistance tomorrow, it will be overbought. Again, I doubt if SPY can go above 126.
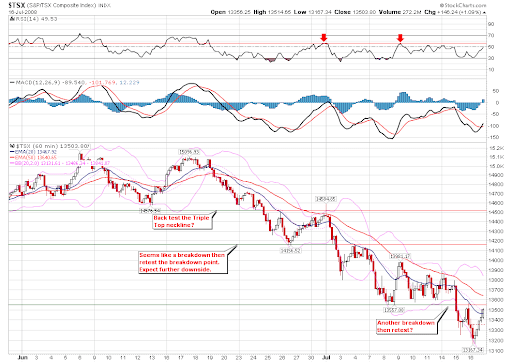
1.4.2 S&P/TSX Composite Index (60 min). This is about Canada market. Breakdown, pullback, will it make a U-turn tomorrow?
5.3.0 Financials Select Sector SPDR (XLF Daily). It is now at the resistance. Are you worrying about your bank deposits? Or money with brokers? By the way, I just got a mail that E*TRADE Canada has been sold to Scotia Bank, thank God! I don't believe XLF will be simply pushed up. Do not convince me XLF has priced in all those troubles if you still have concerns with your money in the banks.
3.4.1 United States Oil Fund, LP (USO Daily). It dropped but the MA(50) still holds. On 3.4.3 United States Oil Fund, LP (USO 60 min) you will see the gap support. By the way, gaps aren't there for being filled, they often provide support or resistance.

1 Comment