Today we have seen a convincing follow-through rally with good volume. Both 2.2.1 NYSE McClellan Oscillator and 2.9.0 S&P 500 Bullish Precent Index show a buy signal, so the market condition is improving, which is shown by those bullish signals in the following chart 0.0.0 Signal Watch and Daily Highlights. However we may see a pullback soon, and if the Tuesday low holds then we will confirm the market has indeed bottomed. If otherwise, there will be two possibilities depending on how deep the pullback is. I will explain it later.
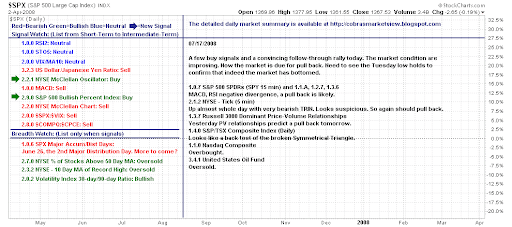
Why will the market pull back tomorrow? Here are two reasons:
- Russell 3000 Dominant Price-Volume Relationships were very bearish yesterday. As I explained, the market would drop as late as the third trading day according to the historical data, which meant this Friday. Furthermore, the price-volume relationship was not very bullish today, 1095 stocks were price up volume up which is good, but 1029 stocks were price up volume down. So actually today's market was not that bullish as it sounds.
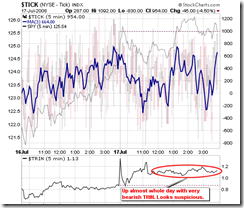
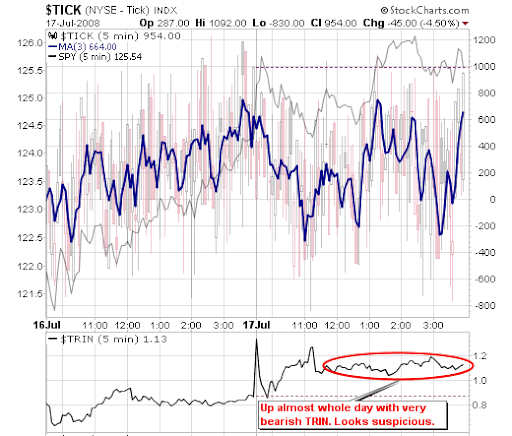
- TRIN worried me today because it stayed above 1 (bearish threshold value) almost all the time. My feeling is that today's rally might lack of commitment, short covering might have played an important role. By the way, on the chart 2.8.0 CBOE Options Equity Put/Call Ratio, $CPC closed at 0.86 which is very bullish. In fact this value is fairly close to over-bullish or even bearish value of 0.8. I am not sure whether it is good if this signal keeps going down.
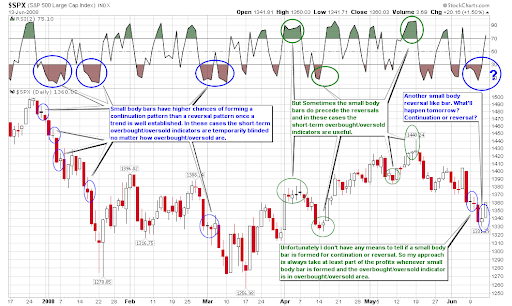
0.0.1 Simple SPY Trading System. The candlestick today is a Doji which hints a trend reversal. You may refer to 8.1.0 Small Body Bar Trading Rule for the trading rule in this case.
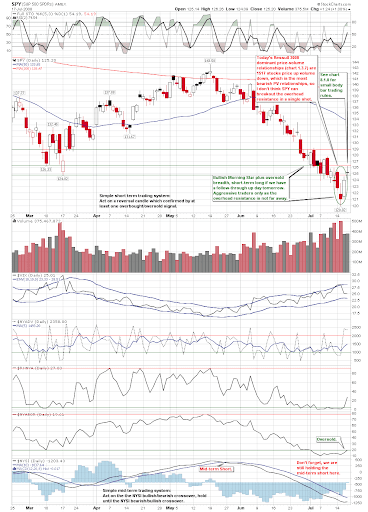
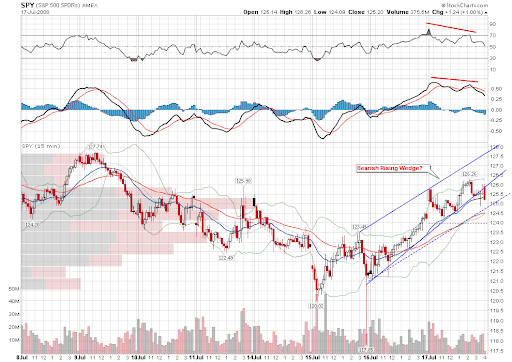
1.0.7 S&P 500 SPDRs (SPY 15 min), 1.1.A PowerShares QQQ Trust (QQQQ 15 min), 1.2.7 Diamonds (DIA 15 min), 1.3.6 Russell 2000 iShares (IWM 15 min). The rally in the last trading hours caused the negative divergence of MACD and RSI indicators. This means the momentum is weakened and the market will likely pull back tomorrow.
1.4.0 S&P/TSX Composite Index (Daily) It seems be testing back the broken symmetric triangle pattern. Canada market will drop down further if the oil price is descending.
3.4.1 United States Oil Fund, LP (USO Daily). It is oversold, and the oil price may bounce back, and then provide a good excuse for the pullback of the stock market.
About my positions and how to trade safely: I think this information may be helpful for you, especially those inexperienced traders. Since last week, I have been reducing the short positions. Now I am still holding a small number of mid-term short positions based on 1.0.0 NYSI signal. In case the market rallies sharply due to overbought technical indicators, I am also holding some long positions to hedge the upside risk. By following TA signals, usually one cannot catch the top or bottom precisely, this is because the market always acts prior to TA signals. Please be advised that missing an rally is fine: if the rally is too short, it doesn't matter even you miss it; if the rally is tradable then it will likely last for a few weeks or even months, in this case you will have plenty of time to get in comfortably. In my opinion, it is better to keep the stock trading profitable and steadily in the long run, instead of taking the risk to catch the top or bottom.

2 Comments