Two points to be noticed that:
- The market did not follow through the reversal on Thursday, and this is no good;
- Most signals are neutral, so the future direction is unknown. However I got a few interesting charts for your information.
1.1.7 QQQQ Outperforms SPY Good Sign? This is a reminder (not even a warning) that QQQQ:SPY is too high. Please note that I am not saying QQQQ is going to sell off immediately, eventually it will pay back, but when? I have no idea.
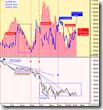
Institutional Buying and Selling Trending from www.stocktiming.com, here is the explanation from the author:
The Institutional Selling shows its trend line making higher/highs and higher/lows ... the definition of an up trend. The Institutional Buying shows its trend line making higher/highs and higher/lows ... the definition of an up trend. Institutions are showing an up-trend in BOTH ... buying and selling. This behavior does not indicate what their predominant intention is. This could mean they are rotating sectors, and/or setting up hedges.
I notice that the setup on the chart looks similar in last September when we saw a firework.
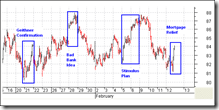
News Driven Market from www.tdtrader.com.
Compare the above chart with the following one, every time prior to the news pop market, CPC is waiting at the extremely low reading, isn't it? Now, the CPC reading doesn't show much enthusiasm to the Wednesday Mortgage Relief Plan, does it? The third time it will be different -- I guess the market will either sell off from Tuesday, or rally without sell on news and continue to go higher afterward. In another words, the market direction on Tuesday could possibly be the real direction. Lastly just to remind you that this is a wild guess, not TA, and should not be take as a guide to trading.


10 Comments