I tend to use "Down Leg" to describe the next phase. But the most bullish scenario is that the down leg starts on Wednesday.
Four points to say: (I think this a typical Ch-English, would anybody mind telling me what I should say? Four things to say, perhaps?)
- From all the aspects such as, technical indicators, Elliott Wave, Astrology, Time cycle and the traditional Chinese "Zhou Yi" (yes, the report you read everyday are the summarize and compromise of all these analysis), the primary theme in the next week is pullback. The only thing I am not sure is whether this coming pullback is only a pullback or another down leg to finish so called "wave 5". In term of probability, down leg is more likely. This scenario is the emphasis of the report, and many evidences will be presented.
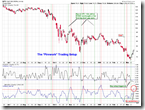
- The recent story has been a firework, but you'd better recall the other half of the firework is to fall onto ground eventually. (Hey, have you ever seen any firework which doesn't fall?) 7.3.2 Firework Trading Setup, you may see that all fireworks in the past have ended up with big sell off with no exceptions so far. Now NYADV is extremely overbought, which is an early warning. On the other hand, in the most bullish case NYADV on 7.0.1 Extreme NYADV and NYMO Readings Watch can stay as overbought for four days. I don't think it could this time, but possibly it can stay until Tuesday which I'll explain in "point 3".
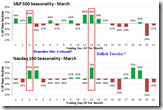
- Based on 7.0.4 Extreme CPC Readings Watch, when CPC is lower than 0.8, the probability of close in green on Monday, is about 69%. However I tend to believe that when both SPX and VIX close green, the next day tends to be a big down day according to 7.0.7 SPX and VIX Divergence Watch, so the market may close in red on Monday. Afterward, the probability of a turnaround Tuesday is about 66%, which is a statistically very bullish Tuesday (courtesy of www.sentimentrader.com). In term of operation, should the market go down slightly on Monday, bears better be careful about the bulls' final strike on Tuesday, don't be knocked down prematurely.
- The rally on Thursday and Friday was a little bit suspicious since the defensive sectors way outperformed which means that the fund is flowing into these sectors for safety. Should this trend continue, a big down is coming.


Well, this seems quite a lot of information. Not over yet, let's go back to present all the evidences needed to support "point 1", which is the main focus of this report.
From the perspective of Elliott Wave, the final wave 5 is incomplete assuming that this round is still conventional 5-wave downtrend. Here is an excerpt of the Friday's report from John Murphy:
MARKET MAY NEED ONE MORE DIP... The weight of technical evidence suggests that the market is close to a rally (which could test the January high). As I suggested on Tuesday, however, I remain concerned that the decline from the January top looks incomplete. I'd prefer to see a five-wave decline instead of the current three waves shown in Chart 5. The current bounce could be just a wave 4. At the risk of putting too fine a point on things, I'd prefer to see one more pullback that either touches a new low or retests the March low to complete a fifth downwave and set up an intermediate recovery. The key is the 800 level. Any move over that level (and its 50-day moving average) would signal that the bottom is in. Either way, it's not too soon to start turning a bit more positive.
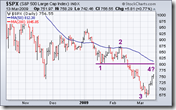

You may still remember Phi Mate Turn Date from Rober McHugh, March 13 is such a turn date which seems a top while the next turn date is March 26. If my analysis is correct, the most likely bottom is around 26th in the context of 5-wave downtrend, therefore bulls should be aware of this possibility. The good news is that after this round of sell off, a decent intermediate term rally will be and the initial target is January high based on analysis using different methods (Elliott Wave, Astrology, Time cycle, Statistics etc etc).

Now let's take a look at why technical indicators support 5-wave downtrend also instead of a technical pullback.
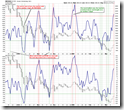
Note the relationship between the brown curve and the blue curve which denotes the market on T2101 from Telechart, every time the turnaround of the brown curve is also the turning point of the blue curve, which means a trend reversal of the market. Last time this chart has successfully predicted the trend reversal (03/09/2009 Market Recap: Speculation Play). Now it turns again, which could possibly mean a bearish reversal of the market.

2.8.1 CBOE Options Total Put/Call Ratio. The normalized CPC at the bottom of the chart is way too bullish, and this is a sign of market topping.

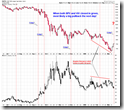
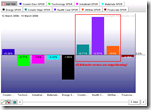
SPX breadth from www.sentimentrader.com shows that 467 out of 500 stocks in SPX close above 10-day moving average on Friday, which is a sign of extremely overbought. Look at the following chart, every time, such overbought condition has marked a market top, hasn't it? Since the number of stocks of SPX closed above MA10 is very important information so I will collect these statistics from now on and log the extreme result on chart 1.3.7 Russell 3000 Dominant Price-Volume Relationships. Additionally, the last time when 460 stocks close above MA10 as illustrated on chart 1.3.7, was exactly the top in January 2009. Note the negative divergence during the last three days of the rally. Finally, the dominant price-volume relationships on Friday is 1212 stocks price up volume down, bearish.


At the end of report, let's review the charts of indices and important sectors.
1.0.2 S&P 500 SPDRs (SPY 60 min). The four day rally looks like a bear flag to me. Note that RSI and STO are still overbought.

1.0.4 S&P 500 SPDRs (SPY 15 min), this bearish rising wedge is very obvious on the chart. STO is also overbought.

5.3.0 Financials Select Sector SPDR (XLF daily). Financial sector had led the rally, however it hits the resistance now. On the chart, there was only one case that XLF had more than 5 consecutive up days.

5.7.0 Technology Select Sector SPDR (XLK Daily). Technology sector which used to outperform, looks bearish now. Should the 5-wave down leg proven to be the case, the puzzle on 1.1.7 QQQQ Outperforms SPY Good Sign? could be resolved. Well, hopefully.


39 Comments