|
||||||||||||||||||||||||
|
||||||||||||||||||||||||
|
*Please make sure you understand how to use the table above. The purpose of this report is to provide info so contradictory signals are always presented.
SEASONALITY: BEARISH EARLY NEXT WEEK, BULLISH LATER
See 08/27 Market Recap for more details.
INTERMEDIATE-TERM: STATISTICS ARE BEARISH, THE NEXT PIVOT DATE IS AROUND 09/07 TO 09/10
See 08/27 Market Recap for more details.
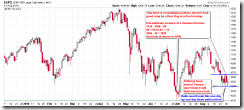
SHORT-TERM: QQQQ HOLLOW RED BAR GIVES BULL HOPES BUT SPX SHOULD BREAK ITS RECENT ONE DAY UP ONE DAY DOWN PATTERN FIRST
With the help of the bullish seasonality on the first trading day of each month (See 08/27 Market Recap), I hope SPX could finally break the recent one day up one day down pattern. No matter how bullish you think the market is going to be, at least for the very first step, the SPX must be able to rise 2 days in a row, agree? So let’s see tomorrow. Overall, the daily chart doesn’t look good, especially the 1040 has been tested 3 times so the chances for it to hold the 4th test is remote. And once 1040 were broken, then according to the Measured Move, the 07/01 low would be the minimum target.
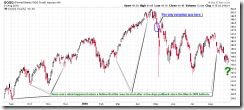
6.4.6b QQQQ Hollow Red Bar Watch, this is a good news for bulls. Whether is today a bottom of some kind, we’ll have to wait for a few days. Just remind you of this chart for now.
HIGHLIGHTS OF THE OTHER ETFS IN MY PUBLIC CHART LIST
| TREND | DTMFS | COMMENT – *New update. Click BLUE to see chart if link is not provided. | |
| QQQQ | DOWN | ||
| IWM | DOWN | ||
| CHINA | UP | Head and Shoulders Bottom in the forming? | |
| EMERGING | DOWN | 4.1.6 iShares MSCI Emerging Markets (EEM Weekly): EEM to SPX ratio too high. | |
| EUROPEAN | DOWN | ||
| CANADA | UP | BUY | |
| BOND | UP | *BUY | 4.2.0 20 Year Treasury Bond Fund iShares (TLT Weekly): Too far away from MA(200). |
| EURO | DOWN | *SELL | |
| GOLD | UP | *SELL | |
| GDX | UP | 4.3.1 Market Vectors Gold Miners (GDX Weekly): GDX to SPX ratio too high. 3.2.1 Market Vectors Gold Miners (GDX Daily): ChiOsc is too high. |
|
| OIL | DOWN | *SELL | |
| ENERGY | DOWN | ||
| FINANCIALS | DOWN | 4.4.2 Financials Select Sector SPDR (XLF Weekly): Head and Shoulders Top in the forming? | |
| REITS | DOWN | 4.4.3 Real Estate iShares (IYR Weekly): Home builder is lagging, be careful. | |
| MATERIALS | DOWN |
*DTFMS = Dual Time Frame Momentum Strategy. The signal is given when both weekly and daily STO have the same buy/sell signals. Use it as a filter, don’t trade directly.


