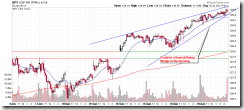
The bottom line, the short-term trend is up. I hold partial long position overnight.
The seasonality worked today, despite bad AAPL news and C ER. Now the question is: Will it work for the rest of the week as mentioned by Stock Trader’s Almanac? Chart pattern wise, could be a small Bearish Rising Wedge in the forming, so if tomorrow not gap up huge (to invalidate the pattern), we could see some weakness at least in the morning.
Demo account for short-term model, $200 max loss allowed per trade. Mechanical trading signal, for fun only.
| TICKER | Entry Date | Entry Price | Share | Stop Loss | Exit Date | Exit Price | Profit | Comment |
| SSO | 01/14/2011 | $50.06 | 50 | $50.73 | ||||
| SSO | 01/14/2011 | $50.06 | 150 | $48.86 | 01/14/2011 | $50.65 | 88.50 | |
| SSO | 01/12/2011 | $49.91 | 100 | $48.25 | 01/12/2011 | $50.11 | 20.00 | |
| SSO | 01/11/2011 | $49.20 | 100 | $48.25 | 01/12/2011 | $50.02 | 82.00 | |
| SSO | 01/11/2011 | $49.20 | 100 | $48.25 | 01/11/2011 | $49.24 | 4.00 | Risk control, half position out. |
| SSO | 01/10/2011 | $48.98 | 100 | $47.65 | 01/11/2011 | $49.38 | 40.00 | |
| SSO | 01/06/2011 | $49.26 | 100 | $48.29 | 01/07/2011 | $48.28 | -98.00 | Stop loss. |
| SSO | 01/06/2011 | $49.26 | 100 | $48.29 | 01/07/2011 | $49.50 | 24.00 | Target met, partial profit. |
| SSO | 01/04/2011 | $49.02 | 100 | $47.65 | 01/05/2011 | $49.38 | 36.00 | |
| SSO | 12/30/2010 | $48.02 | 100 | $48.66 | 01/04/2011 | $48.66 | 64.00 | |
| SSO | 12/30/2010 | $48.02 | 100 | $47.44 | 01/03/2011 | $49.20 | 118.00 | Partial profit. |
| SDS | 12/30/2010 | $23.88 | 400 | $23.60 | 01/03/2011 | $23.30 | -232.00 | Gap down, manual stop loss used. |
| SUM | 146.50 |

